Politologija ISSN 1392-1681 eISSN 2424-6034
2023/2, vol. 110, pp. 8–47 DOI: https://doi.org/10.15388/Polit.2023.110.1
Middle-Income Trap and the Baltic States: Common Challenges, Different Strategies*
Marius Kalanta
Postdoctoral Fellow at the Institute of International Relations and Political Science, Vilnius University
Email: kalanta.marius@gmail.com
https://orcid.org/0000-0002-8515-2075
Abstract. The paper contributes to further advancing research on the middle-income trap in the Baltic States. It argues, first, that while the Baltic States have already surpassed income levels associated with the middle-income trap and continue converging with advanced economies, they still might face risks of the middle-income trap defined as a difficulty to move into higher value-added positions of the value chain. Second, the paper demonstrates that over the course of recent transformations, growth models of the Baltic States have become increasingly divergent with differences between Estonia and Lithuania being most pronounced. Third, it is argued, that growth model differences also imply different risks associated with the middle-income trap. Estonia faces a risk that its leapfrogging into specialisation of ICT-based services remains premature and incapable to deliver productivity levels comparable to those of advanced economies. Yet, Lithuania faces a risk of being incapable to upgrade its large manufacturing sector. Instead, it risks continuously sustaining labour-intensive export-led growth and further taking advantage of cost-competitiveness by diversifying into new industries while still performing lower value-added activities in them.
Keywords: middle-income trap; growth models; Baltic States; comparative political economy.
Vidutinių pajamų spąstai Baltijos šalyse: bendri iššūkiai, skirtingos strategijos
Santrauka. Straipsnis analizuoja vidutinių pajamų spąstus Baltijos šalyse. Jame formuluojami trys argumentai. Pirma, teigiama, kad nors Baltijos šalys jau viršijo pajamų lygį, siejamą su vidutinių pajamų spąstais, ir toliau konverguoja su išsivysčiusių šalių ekonomikomis, jos vis dar gali susidurti su vidutinių pajamų spąstų grėsme, apibrėžiama kaip sunkumas užimti aukštesnės vertės pozicijas vertės grandinėje. Antra, straipsnis atskleidžia, kad dėl pastarojo meto transformacijų Baltijos šalyse susiformavo labai skirtingi augimo modeliai, o skirtumai tarp Estijos ir Lietuvos tapo ryškiausi. Trečia, argumentuojama, kad augimo modelio skirtumai suponuoja skirtingas vidutinių pajamų spąstų keliamas grėsmes. Estija gali susidurti su grėsme, kad jos šuolis į informacinėmis ir ryšio technologijomis grįstų paslaugų specializaciją yra per ankstyvas ir nebus pajėgus užtikrinti išsivysčiusioms šalims artimo našumo lygio. O Lietuvai gresia pavojus nepajėgti transformuoti savo didelio apdirbamosios gamybos sektoriaus, siekti išsaugoti augimą iš darbui ir ištekliams imlių ekonominių sektorių, taip pat toliau naudojantis kaštų konkurencingumo teikiamais pranašumais plėsti diversifikaciją į vis naujus ekonominius sektorius, tačiau juose vis vien užimant mažesnės pridėtinės vertės pozicijas.
Reikšminiai žodžiai: vidutinių pajamų spąstai, augimo modeliai, Baltijos šalys, lyginamoji politinė ekonomija.
_________
Received: 03/02/2022. Accepted: 10/04/2023
Copyright © 2023 Marius Kalanta. Published by Vilnius University Press. This is an Open Access article distributed under the terms of the Creative Commons Attribution License, which permits unrestricted use, distribution, and reproduction in any medium, provided the original author and source are credited.
Introduction
Do the Baltic States (BS) face threats of the middle-income trap (MIT)? Or have they already escaped it? Answering these questions is not easy for two reasons. The first is conceptual. While since its introduction in 2007 by Indermit Gill and Homi Kharas1 the MIT has become a widely used concept to define a certain stage of economic development in emerging or catching-up economies, it still represents a rather helpful heuristic but lacks conceptual clarity and precision. Definitions of the MIT developed over the last decade range from quantitative measures of certain income thresholds to qualitative evaluations of countries’ growth strategies.
The second reason is empirical. Development trajectories of the BS as well as countries in the broader Central Eastern European (CEE) region have been different from those of other emerging economies from East Asia and Latin America such as Malaysia or Brazil typically considered as victims to the MIT. Due to the geographical proximity to Western Europe and successful accession to the EU, the BS have demonstrated fast growth and steady convergence resulting in a successful transition to the group of high-income economies. However, on the other hand, their industrial structures as well as positions within global value chains (GVC) still more resemble emerging than advanced economies. Therefore, at a first glance the answer to the question on whether the BS are caught in or face risks of the MIT cannot be straightforward. While they have successfully escaped the MIT according to some definitions, they still might be considered as facing threats of being trapped according to others.
The existing literature on the MIT in the BS reflects this ambiguity well. While in general concluding that the BS had managed to avoid the MIT if assessed by income levels, growth rates and the speed of convergence with advanced economies, this line of reasoning has commonly been followed by arguments that they still faced risks of falling in the MIT if their growth model (GM) based on price competitiveness, broader resource utilisation and capital inflows was not replaced with skills-, technology- and innovation-based one2. In general, this literature agrees that significantly lower productivity growth, increasing labour costs and lower capital inflows and investment seen after the Global Financial Crisis (GFC) might signal that the existing GM has reached its limits and thus further convergence of the BS with advanced economies can be expected to slow down. For adopting a new GM and thus avoiding the MIT, the countries should focus, among others, on larger education investment, better quality of institutions and governance, moving up the value chain and improving the complexity of exports.
The literature still has several gaps. While stressing on the need for changes of the Baltic GMs, it has mainly limited itself to rather general assessments of the existing GMs as well as providing only broadly formulated policy recommendations for promoting these changes. However, attempts to look in more details at the current Baltic GMs and answering questions on what political-economic and institutional underpinnings of these GMs are and how these underpinnings are linked to the possibilities to implement the prescribed policy recommendations and stay away from the MIT have been scarce so far. Thus, the existing literature lacks a political-economic and institutional account of the existing GMs and prevailing conditions for a GM change. Furthermore, it has implicitly treated all three BS to a large extent as economically, politically, and institutionally homogeneous and, therefore, facing similar challenges of the MIT as well as possessing similar possibilities to address these challenges.
The current paper contributes to advancing further research on the MIT in the BS. It proposes a political economy perspective and provides a better theoretically informed and more detailed view of GM developments and political underpinnings in the BS over the recent decade. For doing so, it brings together two bodies of the literature: one from development studies on the MIT and another from comparative political economy and post-Keynesian economics on GMs. Methodologically, for assessing of the status of the MIT in the BS and identifying their GM types, the paper relies on descriptive statistical data from national accounts. However, it also adopts a most diverse case study method for an in-depth analysis of developments in Estonia and Lithuania.
The paper demonstrates that while the BS might still face risks associated with the MIT, these risks to a significant extent vary among the countries. Over the course of their post-communist transformation and especially after the GFC, the BS have adopted different growth strategies and their GMs become increasingly diverging. Two of them, Estonia and Lithuania, have demonstrated the most pronounced differences. While Estonia has followed a leapfrogging growth strategy aimed at specialising in information and communication technology (ICT)-based services, which, coupled with a strong orientation towards exports, has resulted in a knowledge-intensive services (KIS)-based export-led GM. In contrast, Lithuania has adopted a path-following growth strategy aimed at diversification and gradual catching up with advanced economies. As a result, it has become a low- and medium-low technology (LM/MLT) manufacturing- and non-KIS-driven export-led GM.
The paper is structured as follows. The next section reviews the existing definitions of the MIT and provides a brief quantitative assessment of the MIT status in the BS. Then the subsequent section presents the concept of GMs and provides a detailed quantitative and qualitative assessment of GM types in Estonia and Lithuania. Section 3 discusses GM developments in Estonia and Lithuania from a MIT perspective. The last section concludes.
1. Middle-income trap in the Baltic States
1.1. Defining the middle-income trap
Since its introduction by I. Gill and H. Kharas3, the concept of the MIT has attracted a wide attention of economists and political scientists aiming to answer questions on why in some cases a transition from middle- to high-income status is not smooth or does not occur at all, and whether these difficulties can be qualified as a distinct barrier for further development. These attempts, however, have not resulted in a single unified definition of the phenomena as a major conceptual diversity remains. Importantly, an initial scepticism of some scholars towards the meaningfulness of the concept in general has not been ruled out, too. This subsection presents key definitions of the MIT, reviews its major criticism, and sets the stage for a further analysis of the BS.
All definitions of the MIT produced so far can be categorised into three broad groups4. The first group is empirical. These definitions are characterised by attempts to identify a precise band of income, which comprises difficulties for middle-income countries to pass through and thus can be defined as the MIT. For Michael Spence5 this band expressed as GDP per capita is between 5,000 and 10,000 US dollars in 2005 purchasing power parities (PPP). In his argument, only few countries have managed to pass this band since 1975. This approach has been taken further by Jesus Felipe, Arnelyn Abdon and Utsav Kumar6, who have identified two groups of middle-income countries according to their GDP per capita in 1990 PPP US dollars: the one of lower middle-income between 2,000 and 7,250 and the other of higher middle-income between 7,250 and 11,750. In this argument, a country may be considered as a victim to the MIT if it stays over 28 years in the first band or over 14 years in the second band.
Barry Eichengreen et al.7 and Shekhar Aiyar et al.8 have taken an econometric approach to identifying the income bands by focusing on thresholds, at which growth slowdowns are likely to occur. B. Eichengreen et al.9, based on analysis of growth rates over the several decades period, have shown that growth tends to decelerate in two stages: first when countries reach 10,000–11,000 and then when they reach 15,000–16,000 US dollars in 2005 PPP of GDP per capita. While S. Aiyar et al.10, based on growth deviations from predictions of convergence framework, have revealed that the probability of growth slowdowns increases in a broad income band between 2,000 and 15,000 US dollars in 2005 PPP of GDP per capita.
The second group of definitions defines the MIT in terms of an absence of convergence to a benchmark advanced country, typically the US. Thus, a country is considered a victim to the MIT if its convergence to the US or any other advanced economy stops. Using this definition, The World Bank11 has calculated that of 101 middle-income economies in 1960 only 13 have been successful in reducing the income gap to the US to an extent to become a high-income country by 2008. In this calculation, an approximate threshold of 50 per cent of US GDP per capita between middle- and high-income countries was used. Similarly, Fernando G. Im and David Rosenblatt12 have shown that most large middle-income countries grow way too slowly to converge with the US or an aggregate of high-income OECD economies in 50 years.
Recent empirical evidence suggests, however, that successful convergence with an advanced economy and, thus, escaping the MIT is not necessarily stable and unidirectional. Divergence and falling back to the MIT might also be a likely scenario. This is well demonstrated, for example, by Equator Guinea, Greece and Portugal. All three have been listed among those 13 successful escapers by the World Bank study, however, later their convergence to the US not only stopped but reversed. Recent World Bank data demonstrates that divergence was strongest in Equator Guinea, which had 64 per cent of US GDP per capita in 2008 yet fell back to 23 per cent by 2021. Similarly, Greece fell from 67 per cent to 46 per cent and Portugal from 58 per cent to 53 per cent.
The third group consists of descriptive definitions of the MIT. It is the approach to defining the MIT followed by I. Gill and H. Kharas13 with their original formulation but also by H. Kharas and Harinder Kohli14 and Keun Lee and Sanika S. Ramanayake15. In their view, the MIT is a structural characteristic of the economy, which develops during the transition from low- to middle- income and refers to an emerging economy that encounters difficulties in making a transition from resources and low-cost driven economic growth to high-skill, innovation, and productivity driven growth. The MIT occurs from an exhaustion of strategies of production factor maximisation that facilitated growth during the transition from low- to middle-income status coupled with policy misdiagnosis when countries fail to match their growth strategies with structural characteristics of their economies. As a result, countries lose the capability to compete with low-income, low-wage economies in manufactured exports faster than they acquire new capabilities to compete with advanced economies in high productivity and high-skill innovations. At the micro-level, this definition links the MIT to difficulties in improving firm-level technological capabilities16 or moving up the value chain from a stage of technology absorption through foreign direct investment (FDI) to a stage of an increased domestic capacity to develop own technology17.
I. Gill and H. Kharas18 identify two policy misdiagnoses that may lead to falling into the MIT. First, to preserve their existing competitiveness mode, countries may attempt to sustain labour-intensive manufacturing exports-led growth despite competitive disadvantage caused by higher wages. As a result, countries may continue promoting industrial diversification rather than specialisation in industries where they have structural strengths. Second, countries may attempt to leapfrog prematurely into “knowledge economies” with no relevant institutional infrastructure in place such as high quality of universities, high levels of human capital, deep capital markets and supportive regulatory frameworks. As a result, investment returns from such leapfrogging may be low as countries may struggle to become innovation leaders.
Despite significant progress in defining the MIT, for some scholars, even those involved, it neither seems to result in a sufficient theoretical treatment of the phenomenon, nor provide a sufficient proof of its existence. As argued by F. Im and D. Rosenblatt19 and J. Felipe et al.20, a growth or convergence slowdown, as suggested by empirical and convergence-based definitions, should not be considered a trap but only that some economies grow more slowly while others do so faster. However, this does not necessarily mean that a slower growing economy will be unable to reach high-income status ever. In their view, the MIT concept seems to be based on “outlier worship”, that is on a handful of countries mainly from East Asia, that have demonstrated exceptionally rapid transition from low- to high-income status. Yet, it also tends to neglect the fact that historically convergence has always been slow on average even when it comes to past growth levels of now established high-income economies.
These scholars, therefore, tend to reject the existence of the MIT as a generalised phenomenon. Nonetheless, they tend to agree that the concept might be useful for guiding policy discussions. Or as the European Bank for Reconstruction and Development frames it “The “middle-income trap” is about rethinking a country’s economic development model rather than overcoming a particular level of income”21. The consensus among scholars seems to be stronger here. And this was exactly the intention of the original formulation by I. Gill and H. Kharas22. In general, the debate seems to be shaped by disciplinary boundaries. From a perspective of economics, the concept of the MIT is of little use as it focuses, however without making a unique contribution, on what has been the focus of the standard growth theory for many years, that is why some countries grow more slowly than others. Yet, from a political economy perspective, the concept appears more meaningful as it focuses on the political and institutional sides of the transition through middle-income status. In this view, slow speed of growth or convergence with high-income economies should not be considered as ‘normal’ even if history suggests treating it as such. As the literature has shown, at this stage of development, on the one hand, a higher need to modify the existing growth model for resuming higher growth is likely to emerge, while on the other, certain socio-economic cleavages such as inequality and divergent interests between local and foreign businesses inherited from the earlier stages of development can impede these needs from implementation23.
1.2. Are the Baltic States trapped?
Now I provide a brief straightforward assessment of the MIT status in the BS. First, I apply income thresholds identified by M. Spence24, S. Aiyar et al.25 and B. Eichengreen et al.26. In these thresholds, depending on the method, the upper bound of the middle-income level ranges from 10,000 to 16,000 US dollars in 2005 PPP of GDP per capita. The Penn World Table shows that in 2019 GDP per capita was around 27,000 US dollars in Estonia, 24,000 US dollars in Latvia and 26,000 US dollars in Lithuania (all in 2005 PPP)27. Thus, according to the empirical definition of the MIT, all three BS have already confidently transited to the group of high-income economies. Furthermore, the BS are also classified as high-income economies by the World Bank28.
Next, I evaluate the progress of income convergence of the BS with advanced economies. Bold lines in Figure 1 demonstrate this. Here, convergence is measured as GDP per capita in purchasing power standard (PPS)29 of each BS as a share of a benchmark GDP per capita of advanced economies. The latter is calculated as the 3rd quartile of all EU economies plus Iceland, Norway, Switzerland, and the United Kingdom.
Figure 1 shows that convergence of the BS was steady for the entire period of more than 20 years under observation. The trend was interrupted only twice: in 1999 and 2009 due to negative shocks posed by the Russian financial crisis and the GFC, respectively. As a result of the convergence, all three countries have achieved a major progress and become much closer to advanced economies. If in 1995 all three economies had GDP per capita in PPS in the range between 24 and 28 per cent of advanced economies, in 2019 these levels exceeded 55 per cent in Latvia, 60 per cent in Estonia and approached 70 per cent in Lithuania surpassing the threshold of around 50 per cent between middle- and high-income economies commonly used in this MIT definition. Interestingly, if Estonia was a convergence champion until the GFC, Lithuania took over the crown afterwards. This signals about changes in the speeds of convergence. In 1996–2007 the rate of annual convergence on average was 2.2 percentage points in Estonia and 1.9 percentage points in Lithuania. Yet during 2010–2019 Estonia started converging more slowly, while Lithuania faster: 1.4 and 2.2. percentage points, respectively. In Latvia, convergence slowed down too: from 1.9 to 1.3 percentage points on average annually.
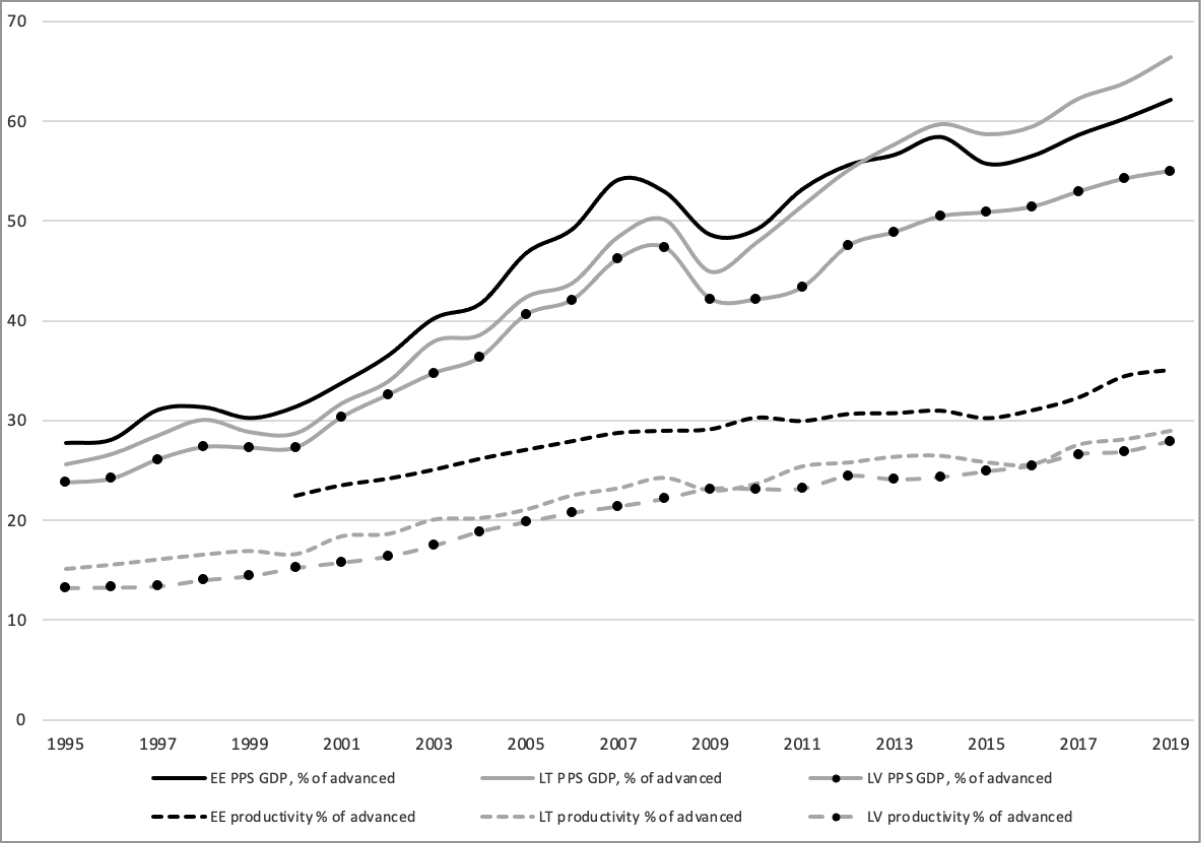
Figure 1. GDP and productivity convergence in the BS.
The benchmark of advanced economies is the 3rd quartile of EU, EFTA (Lichtenstein excluded) and the UK. Productivity is gross value added per hour worked. Source: Eurostat.
The assessment according to both empirical and convergence-based definitions has convincingly shown that the BS do not seem to face threats of the MIT. All three countries have successfully passed the income thresholds associated with the MIT in the literature and continue further converging with advanced European economies, albeit at a slower pace. However, the picture appears to be less clear and evidence rather mixed when it comes to the assessment based on the descriptive definition of the MIT. On the one hand, evidence shows that the transition of the BS into the group of high-income economies has been essentially driven by regionally shaped factors associated with the EU accession such as external commitment to reform implementation30 and trade openness31.
On the other hand, there is also evidence that the BS have accessed the group of high-income economies without fully acquiring certain properties of advanced economies. In particular, the BS are less productive. As demonstrated in Figure 1 (dotted lines) in 2019 productivity was only at around 30 per cent in Latvia and Lithuania and 35 per cent in Estonia of the level of advanced economies. Importantly, Figure 1 also clearly demonstrates that in all three BS, convergence of GDP per capita in PPS is faster than convergence of productivity.
Large differences in productivity suggests that the BS for economic growth still rely more on resource-intensive activities and implementation capability, which is a capability to efficiently produce less complex products and assemble final ones, than on technological and design capabilities32. In this regard, to become innovation-driven economies, the BS can be considered as facing a need for a further structural transformation and transition to a new GM, and thus, facing certain risks of the MIT33. However, as it is still an ongoing process, a final assessment of how large these risks are cannot be performed. Yet, a deeper look into this process could be valuable.
2. Growth model transformations in the Baltic States
In this section, I analyse the Baltic GMs. I first look at major structural trends that the Baltic economies have undergone recently. Then I present a conceptualisation of GMs followed by an empirical assessment of GM types that have been consolidated in the BS over the last decade.
2.1. Economic developments in the Baltic States
A first obvious trend in the Baltic economies is high reliance on exports for economic growth. Here the GFC represented a key turning point. In all three countries, the recovery from the GFC was accompanied by strong exports performance driven by a favourable combination of structural changes such as the access to a large internal market granted by the EU membership34, an increasing integration in global and European value chains35, a strong expansion in productive capacities36 and improved technological competitiveness and regulatory quality37.
In 2010 alone nominal value of exports of goods and services grew by 31 per cent in Lithuania, 28 per cent in Estonia and 19 per cent in Latvia returning the total value of exports in each country to the highest pre crisis levels in just one year (Eurostat Data). Growth of similar magnitude continued in 2011, too. The pace slowed down afterwards, however, but remained relatively strong. As a result of strong exports performance, the BS have become highly internationalised, as indicated by the dynamics of exports-to-GDP ratios (Figure 2, left panel). In 2019 both Estonia and Lithuania had exports-to-GDP ratios at above 70 per cent, while Latvia at around 60 per cent. These values are comparable to those of other exporting EU economies such as Belgium or the Netherlands and exceed the EU average by more than 10 percentage points.
The second trend is an increasing divergence between the BS in economic specialisation. I assess these changes on two dimensions: a change in a share of KIS in total value added and a change in a share of high- and medium-high-technology (HT/MHT) manufacturing in total value added. The right panel in Figure 2 plots the BS on these two specialisation dimensions over the period from 2000 to 2019 (2018 for Lithuania). The countries had more similar positions in the beginning of the period than they ended up. Not only that the countries experienced different extents of changes, but they also moved to different directions.
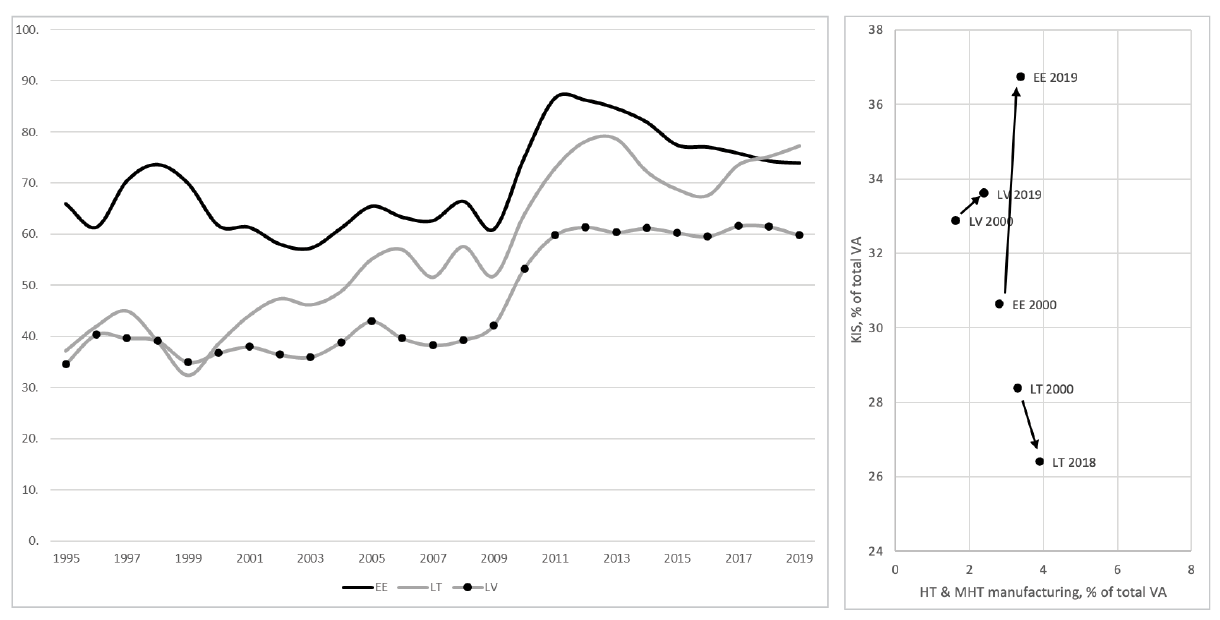
Figure 2. Exports-to-GDP ratios (right panel) and changes in economic specialisation (bottom panel) in the BS.
KIS – knowledge intensive services, HT & MHT – high-technology & medium-high-technology, VA – value-added. Source: Eurostat.
In 2000 Latvia was the most KIS-specialised economy among the three, however, further changes have been only negligible here. In contrast, Estonia stands-out as the country that achieved the highest change. In 20 years, its share of KIS increased most, while an increase in a share of HT/MHT manufacturing was negligible. As a result, Estonia has become highly specialised in high value-added services. Several other indicators support this argument. Of all CEE countries it scores highest in the European Innovation Scoreboard and is the only country that has achieved a status of strong innovators38. Also, it scores highest in the Digital Economy and Society Index39. Here it leads CEE and stands extremely high even compared with advanced economies in indicators such as digital skills, a share of ICT graduates and employed ICT specialists, employment in KIS, and digitalisation of public services. Furthermore, Estonia’s ICT sector, as a share of GDP, is among the largest in the EU. This sector has one of the highest R&D intensities as measured by both public and business expenditures and employs more than a third of the country’s total R&D personnel. The services part of the ICT sector has accumulated one of the largest stocks of capital investment per capita and grows the highest number of start-ups per capita in the EU40.
Lithuania has demonstrated a completely opposite trend. Over the two decades its share of KIS decreased, while a share of HT/MHT manufacturing grew only negligibly. On the services part, this has been driven by a faster growth of lower value-added services. Subsequently, for example, the size of ICT, financial and insurance services as a share of total value added decreased from around 7.8 per cent in 2005–2007 on average to 5.6 per cent in 2015–2017, while the size of land transportation services increased from 6.2 to 7.7 per cent, respectively (Eurostat Data). Furthermore, of all the BS Lithuania has the largest manufacturing sector constituting around 19 per cent of the economy. This makes lower value-added activities prevalent in the Lithuanian economy to a much larger extent than in Estonia.
Major shifts in economic specialisation in Estonia and Lithuania seem to correspond with societal changes, therefore, can be considered as deeply structural. Based on the European Socio-Economic Classification and data from the European Social Survey41, Vaidas Morkevičius et al.42 argue that during the period between 2008 and 2014 Estonia experienced a large shift of its social class structure towards high-wage and high-skill salariat classes, while its working class decreased in size most among CEE countries. In their argument, if at the beginning of the period Estonia’s class structure was comparable to an industrial-type class structure of other CEE countries, by the end of the period it moved closer to the structure of advanced post-industrial economies. In contrast, the authors find a different trend in Lithuania. After the GFC, its salariat classes shrunk by several percentage points, while the working class demonstrated a slightly growing trend.
2.2. Defining growth models
How can we conceptualise a high reliance on exports and differences in economic specialisation that started to characterise the BS in the last decade? For doing so, I turn to recent advancements in GM analysis in comparative political economy and post-Keynesian economics. In this literature, a GM is defined as a combination of strategies, policies and existing institutions that core actors of the economy employ for securing higher rates of economic growth43. In more specific terms, a GM is an institutional and political configuration that enables a political economy to employ certain sources of aggregated demand for its growth44.
The concept of GMs interconnects three key political-economic dimensions. The first dimension is macroeconomic. While an economy can rely on a variety of sources of aggregated demand, usually not all of them deliver growth, and if they do, they contribute differently. These growth contributions are four: domestic consumption, investment, government spending and net exports. While economies can rely on a combination of several of them, typically one tends to dominate.
One of the most elaborated versions of the GMs taxonomy distinguishes between four GMs: two variants that rely on domestic demand as the main source of economic growth, and two variants that rely on exports45. Differences between the variants of domestic demand-reliant GMs are based on which sector of the economy consumes more than it earns and thus generates extra demand and growth. If it is the government sector via government consumption and/or the corporate sector via investment, the GM is said to be ‘domestic demand-led’. But if the main source is household consumption commonly fuelled by high availability of credits, then ‘a debt-led private demand boom GM’ is in place.
Both variants of export-led GMs are distinctive in that the major source of aggregate demand comes from abroad. The difference between the two variants is in the intensity of the role exports play in generating economic growth. If this role is strong via high contribution of net exports to growth and high current account surpluses, a GM is ‘export-led mercantilist’. If the role of exports is moderate because of either negative growth contribution of net exports, or slight current account deficits, a GM is ‘weakly export-led’.
It is important to note, that the composition of exports can differ significantly both between and within emerging and advanced economies. Advanced economies are innovation and high-productivity driven, while emerging economies are resource utilisation- and labour cost-driven. Thus, for example, an advanced economy and an emerging economy can both adopt export-led GMs, however, exports of the former will largely be composed of innovation- and technology-based products, while resource- and labour-intensive products will prevail in exports of the latter. To account for a more nuanced view, some scholars have made attempts in identifying a wider range of subtypes of export-led GMs such as those driven by exports of commodities and low-quality manufacturing46, exports of high-quality manufacturing and dynamic services47, and FDI-financed exports48.
The second conceptual dimension of GMs is institutional. The line of reasoning here is that a country can utilize a certain source of aggregate demand only if it has the institutional capacity to do so. Domestic demand-led GMs need large redistributive capacities, while liberalised financial markets and high availability of consumer credit and mortgage financing are essential for debt-led private demand boom GMs. Similarly, countries’ capacities to utilize certain types of exports are different. These differences come from differences in innovative and technological capability, a lack of which prevents growth of emerging economies to be driven by exports of high-quality manufacturing or dynamic services. But also, they come from the capacity to deliver wage restraint or promote improvements in productivity, which are essential for staying competitive internationally. While tradable KIS are least sensitive to cost increases49, low-quality manufacturing and production of commodities are most. Some advanced economies have developed the most complex institutional mechanisms for wage moderation and productivity improvements such as coordinated wage setting, publicly financed skill formation and social protection systems, and nonaccommodating monetary and restricted fiscal policies50. In contrast, FDI-financed and low-quality manufacturing- and services-driven exports more commonly rely on other mechanisms of cost moderation such as high levels of wage flexibility.
The third dimension is political. The capacity to employ certain sources of aggregate demand strongly relies on political decisions to build favourable macroeconomic policy regimes51 such as discretionary fiscal and wage policies in the domestic demand-led GMs, financial deregulation, and higher availability of private credit in the debt-led private demand boom GMs, and economic openness and price and nonprice competitiveness in export-led GMs. Importantly, the GM literature views politics not as a solely government’s responsibility but as an outcome of broader socio-political dynamics. A valuable and commonly used conceptualisation of these dynamics is based on social blocks seen as cross-class or cross-sectoral alliances of socio-economic groups united by common ideologies and mediated by political parties52. In less corporatist and less institutionalised emerging economies, social blocks can also emerge on the basis of informal networks and interpersonal and reciprocal relationships between business and the state53. Key socio-economic classes, sectors of the economy or business groups might favour different GMs, therefore, they compete over establishing and sustaining their preferred GMs via producing legitimising discourses and winning support of political parties and the government.
2.3. Growth models in Estonia and Lithuania
I now turn to an empirical analysis of GMs in Estonia and Lithuania as two most diverse cases. I first assess quantitatively the GM types and then present an analysis of their institutional and political underpinnings. For determining GMs, I apply a method based on demand contributions and sectoral financial balances proposed by Eckhard Hein et al.54 but also used in Petra Dünhaupt and E. Hein55, E. Hein and Judith Martschin56, and Ümit Akcay et al.57. To identify GM changes, I also investigate GM types before and after the GFC.
Table 1. Demand contributions and sectoral financial balances in Estonia and Lithuania.
|
Estonia |
Lithuania |
|||
|
2000–2007 |
2010–2017 |
2000–2007 |
2010–2017 |
|
|
Real GDP growth rate, % |
8.0 |
3.5 |
7.6 |
3.4 |
|
Growth contributions, percentage points: |
||||
|
Domestic demand including inventories |
10.8 |
4.0 |
9.4 |
3.2 |
|
4.6 |
1.7 |
2.8 |
1.2 |
|
5.0 |
1.6 |
5.9 |
1.9 |
|
0.5 |
0.4 |
0.5 |
-0.1 |
|
Net exports |
-3.1 |
-0.2 |
-1.8 |
0.3 |
|
Net exports of goods and services, % of nominal GDP |
-6.9 |
4.0 |
-7.6 |
0.2 |
|
Financial balances, % of nominal GDP: |
||||
|
Private sector |
-10.7 |
3.2 |
-5.6 |
5.0 |
|
-3.9 |
0.9 |
-0.2 |
-1.3 |
|
-6.8 |
2.2 |
-5.5 |
6.4 |
|
Public sector |
1.4 |
0.1 |
-1.6 |
-2.7 |
|
External sector |
10.0 |
-3.3 |
6.4 |
-2.3 |
Source: AMECO Database.
The method locates different GMs in different national configurations of demand contributions and sectoral financial balances. Importantly, both sets of indicators are interpreted together. Decisive characteristics of debt-led private demand boom GMs are negative financial balances of the private sector, positive financial balances of the external sector, significant growth contributions of domestic demand and private consumption demand in particular, and negative growth contributions of net exports. Weakly export-led and export-led mercantilist GMs share core characteristics, which include positive financial balances of the private sector, negative financial balances of the external sector and positive trade balances (net exports) of goods and services. The two variants differ in growth contribution of net exports, which is positive in export-led mercantilist GM and negative in weakly export-led one58.
Table 1 presents relevant calculations. Both Estonia and Lithuania, as they recovered from the GFC, experienced major GM changes. While both had debt-led private demand boom GMs before the GFC, they both shifted to export-led GMs after the GFC, however, differing at a variant level: an export-led mercantilist variant in Lithuania and a weakly export-led one in Estonia. This is indicated by following changes in demand contributions and sectoral financial balances. Before the GFC, in both countries, the largest demand contribution to GDP growth was private consumption, and the private household sector ran the largest financial deficits. After the GFC the role of private consumption in GDP growth diminished, financial balances turned positive in the private sector and negative in the external sector alongside with trade balances turning positive. In addition, in Lithuania, growth contribution of net exports turned positive. This is an indication of a stronger reliance on exports. It is important to note that investment also played an important role in both pre- and post-GFC Estonia, while this role was more moderate in Lithuania.
The transition of Estonia and Lithuania through capital inflows-induced debt-led private demand boom in 2000–2007 has been extensively studied in the literature59. To present the story briefly, this period generated historically high growth rates in all three Baltic States at the time called ‘the Baltic Tigers’ with real GDP growth of the magnitude of 8 per cent in Estonia and 7.6 per cent in Lithuania on average annually. This impressive growth was largely stimulated by rising real wages, which almost doubled, expanding private credits, which amounted to more than 50 per cent of GDP, one of the largest in CEE and with consumer lending constituting around a half of it, and extensive investment, which stimulated productivity growth. One of the strongest in the EU increases in housing prices has positively contributed to facilitating credit growth.
Fast growth of private credit was a result of massive net capital inflows, which during 2003–2007 cumulatively amounted, as a share of 2003 GDP, to 111 per cent in Estonia and 85 per cent in Lithuania. Macroeconomic and institutional environment was favourable for that. Successful establishment of Euro-anchored fixed exchange rate regimes as well as positive prospects of the EU and NATO accession in the early 2000s granted Estonia and Lithuania with an increased confidence of international financial markets in their macroeconomic resilience and future growth. The largest share of net capital inflows came through banks and here a highly concentrated and foreign ownership-based composition of the banking sector was highly favourable.
Debt-led private demand boom GMs in Estonia and Lithuania came to an exhaustion at the onset of the 2008–2009 GFC. Already in late 2008 in both countries, accessibility to private credit came to a complete halt. As a result, demand for housing, consumption, investment and exports collapsed bringing down asset prices. By the end of 2009 housing prices fell from the peak by 48 per cent in Estonia and 37 per cent in Lithuania (OECD Data). The collapse of the GMs resulted in an exceptional by global standards GDP contraction of around 15 per cent60.
Serving as a critical juncture, the GFC provoked a GM change in both countries. As a result, the countries recovered from the GFC by more heavily relying on exports as a source of growth. However, Estonia and Lithuania relied on significantly different export profiles. While tradable and nontradable KIS became key drivers of growth in the Estonian GM, LT/MLT manufacturing and non-KIS played a major role in the Lithuanian GM. As argued by Marius Kalanta61, these differences can be linked to differences in the industrial structures that evolved over time but also to different growth strategies aimed at recovery from the GFC and different political and institutional conditions in support of them. Bellow I summarise this argument.
In 2008–2009 both Estonia and Lithuania adopted similar internal-devaluation-based strategies of economic adjustment and achieved to a large extent similar effects on both fiscal revenue and expenditure sides62. However, these adjustment strategies served different political strategies of economic recovery and growth. The main growth strategy followed by the Estonian government was aimed at meeting the Maastricht criteria for euro adoption, restoring confidence of the financial markets and foreign investors and, in fact, returning to the previous GM. For achieving these goals, Estonia had favourable initial economic and fiscal condition such as a currency peg and a balanced budget. But it also had strong political and ideological stance that introducing the euro would have distinguished Estonia from other CEE countries in the eyes of foreign investors and compensated for the painful measures of internal devaluation63.
The socio-political context was also favourable for the continuity to the existing GM. The composition of the social block that underpinned the earlier debt-led GM largely remained unchanged. The choice of the internal-devaluation-based adjustment strategy protected mortgage holders from losses. They mostly came from urban middle classes, a core electoral constituency of centre-right parties that controlled the government cabinet during the GFC. Defaults on housing loans would have inevitably incurred due to an extremely high share of foreign-currency denominated loans in the private credit stock if external devaluation was chosen64. Through this channel internal devaluation also favoured financial, real estate and construction sectors.
Importantly, in the Estonian economy, the financial sector played a much more prominent and complex role than simply financing consumption and investment, thus its strong position within the social block continued. During the earlier debt-led growth, investment by Nordic banks comprised a major share of the Estonian inward foreign direct investment stock, which at that time was already large. Furthermore, Nordic banks, through the establishment of R&D hubs for digitalisation of financial services, were a source of technological spill overs. This, coupled with a strong Estonian government’s priority for e-government initiatives, of which the country had become world-famous, resulted in a deep public-private partnership in designing and implementing of nation-wide ICT development initiatives65.
As the social block remained unchanged and the intention was to return to the previous GM but also because a required extent of rebalancing of the budget was not high, restoring cost competitiveness of domestic manufacturing enterprises was not an explicit goal of the Estonian government. Hence, no specific fiscal or industrial policies were adopted. This is reflected in usual indicators of cost competitiveness such as real effective exchange rate (REER) and real unit labour costs (RULC). While depreciating slightly during and straight after the GFC, these indicators soon surpassed pre-GFC levels. Furthermore, Estonia recovered from the GFC with higher average wage share than it had before it. As a reaction to these price competitiveness and wage developments, some scholars have even expressed doubts about whether internal devaluation can be considered successful at all in Estonia66.
In contrast to Estonia, the Lithuanian government followed a different strategy. It was a strategy of improving cost competitiveness of domestic firms. Therefore, in addition to fiscal consolidation measures, it favoured deeper wage restraint as well as measures targeted at promotion of entrepreneurial activity and exports. This strategy resulted from both larger fiscal necessity and changes in the social block. Lithuania entered the GFC with significant fiscal deficits so fiscal consolidation measures had to be harder67. While euro adoption was not an immediate target for the government due to an unsuccessful attempt in 2007, the internal-devaluation-based adjustment strategy to a large extent served to save from losses foreign-currency denominated mortgage holders but also manufacturing and construction enterprises with euro-denominated credits.
At the same time, as the banking sector played a more traditional role mainly limited to financing the economy and consumption in Lithuania, its reputation became more fragile, while the sentiment to blame foreign banks for causing the crisis increased among opposition parties and socio-economic groups hurt hardest by the economic downturn and austerity measures. On the other hand, as a result of strong expansion during the earlier years, interests of domestic businesses from manufacturing as well as construction sectors, especially interests related to restoring cost competitiveness lost during the earlier debt-led growth, gained higher political salience and played a more prominent role in designing the adjustment and growth strategies, and were associated with future growth. The government addressed these interests explicitly by placing them in the centre of its official recovery strategy.
It is not only that the internal-devaluation-based adjustment strategy was aimed at serving government’s interests of fiscal consolidation and businesses’ interests of restoring cost competitiveness, but also the institutional and social conditions were favourable for achieving these goals. Due to a highly flexible wage-setting system68 and high levels of outward mobility of labour69, the effects of internal devaluation on wages were large. As a result, Lithuania achieved much deeper and longer-lasting devaluation of its REER and RULC. In 2010, the first year after the GFC, it achieved its REER lower by 10 per cent, while RULC decreased by spectacular 30 per cent during 2009–2011. Both effects lasted almost for the entire subsequent decade.
Summing up, GM transformations were much larger in Lithuania than Estonia. In the former, it was underpinned by a combination of the internal-devaluation-based adjustment strategy adopted by the government, changes in aggregated interests within the social block driven by the expansion of domestic businesses in manufacturing and construction sectors as well as reputational vulnerability of the foreign-owned financial sector, and institutional conditions capable to generate deep wage devaluation. The resulting growth strategy focused on the promotion of domestic entrepreneurial activity and exports and on improving cost competitiveness of domestic enterprises. As focus on exports was much stronger and wage devaluation much larger than in Estonia, this resulted in a more extreme, export-led mercantilist, GM.
3. Discussion
Until now I developed two separate arguments: one on the MIT in the BS and the second on the Baltic GMs. In the former, I argued that while the BS have already confidently surpassed the income levels associated with the MIT, they still might be seen as facing difficulties to move up the value chain. The second argument provided evidence on GM shifts that the BS underwent recently. Importantly, because of these shifts, two different GMs emerged as the countries started to rely on different sources of aggregated demand for their economic growth. An important conclusion that follows from the analysis of GM changes in Estonia and Lithuania is that while both countries adopted to a large extent similar paths of export-led growth, their deep intrinsic differences indicate that they have set themselves on diverging paths of socio-economic development. Now I will bring and discuss both arguments together to reveal whether GM differences between Estonia and Lithuania suggest that the threats they face from the MIT might also be different.
With the adoption of a weakly export-led GM, Estonia strengthened its capacity to produce and export ICT-based KIS. Although contrary to what the government expected at the onset of the GFC, Estonia did not return to the previous extent of debt-led growth, it in many respects recovered from the GFC more like a next developmental stage of the same GM capable of combining demand from exports and consumption due to its increasing specialisation in KIS and lower dependence on wage restraint. Therefore, at least until recently, Estonia seemed consistently to continue following a broader national development strategy it set itself on at the onset of its independence. At that time a bold vision of Estonian political and academic elites was cutting ties with the Soviet economic and technological legacies and compensating for the time lost during 50 years of occupation by leapfrogging the West with its own newly emerging ICT technologies-based development path70.
During two recent decades Estonia moved closer to realising this vision. It has become world-famous for its digital services and solutions, and its ICT specialisation has permeated many of its socio-economical domains: from e-government solutions, such as large-scale public services digitalisation, e-voting or e-residency, to strategies of capital, skills and knowledge accumulation, to the national identity represented by the e-Estonia brand. Furthermore, as demonstrated by cross-country innovation indicators, of all three BS, Estonia has advanced furthest in building favourable institutional conditions for innovation71. However, its level of productivity still sets it closer to other BS than advanced economies. Therefore, the grand vision of leapfrogging the West is not yet completed. Consequently, this also suggests a specific nature of the MIT faced by Estonia. A lack of significant productivity differences from other BS indicates that while Estonia heavily specialises in ICT-based services, it still occupies lover value added positions in global value chains of ICT services and is uncapable to generate high returns from this specialisation. Therefore, Estonia can be considered as facing risks associated with premature leapfrogging72.
In contrast, since the establishment of the independence, no specialisation played a role in the Lithuanian national vision of catching-up with the West. Nonetheless, it is now clear that Lithuania has set itself on a more traditional manufacturing-based path-following development trajectory, which leads to catching-up with advanced economies through assimilating and adopting well established technologies and then gradually moving up the technological ladder. This development trajectory has become apparent since the GFC, when Lithuania experienced a radical change of its GM from one driven by debt-led private consumption to strongly export-led one. It built a strong capacity to export domestically produced LT/MLT manufactured goods and this sector has seen the largest expansion since the GFC. However, this capacity to a large extent rested not on technological advancement but on the capacity of wage restraint, which had become deeply politically and institutionally rooted.
A cost competitiveness component but also institutional flexibility constitutes an important part of the Lithuanian export-led GM. Furthermore, the new GM has proven capable to deliver relatively high growth rates and resilience to external shocks, as was recently demonstrated by the COVID-19 pandemics. Therefore, it receives broad support within the domestic business-based social block. Yet, from a MIT perspective, it is vulnerable to specific sorts of risks. These are risks of continuously sustaining labour-intensive manufacturing export-led growth and excessively focusing on diversification to new industries with no economic foundations but with a possibility to take further advantage of cost-competitiveness. These risks can act as barriers to specialisation and hence, a consequent transition to a higher, technological and design capabilities-based stage of development of the manufacturing sector73.
Conclusion
The paper had two aims. First, it aimed at bringing more clarity to academic and policy discussions on the potential vulnerability of the BS to the MIT. In doing so, the paper demonstrated the ambiguity of existing MIT definitions when applied to the BS. If assessed by the income level and the speed of convergence with advanced economies, the BS do not seem to face any threat of the MIT. All three have successfully passed the income thresholds associated with the MIT in the literature and continue further converging with advanced European economies, albeit at a slower speed.
However, the picture appears less clear, and evidence becomes rather mixed when it comes to defining the MIT as a difficulty to transit into higher value-added positions of the value chain. The BS have accessed the group of high-income economies without fully acquiring certain properties of advanced economies. In particular, the BS are less productive and for economic growth still rely more on resource-intensive production and implementation-driven activities within GVCs rather than on technologically advanced production, own technology development and product design-related stages. In this regard, the BS can be considered as still being in the need for a further structural transformation and transition to a new GM, and thus, facing certain risks of the MIT. However, as it is still an ongoing process, a complete assessment of the extent of these risks cannot be performed.
The second aim of the paper, nonetheless, was to look deeper into this still relevant to the BS definition of the MIT by providing a more nuanced account of the existing Baltic GMs and MIT-related risks that these GMs might face. The paper has demonstrated that while all BS face common challenges of the MIT, they address these challenges differently as they follow different development trajectories. This is especially pronounced in the cases of Estonia and Lithuania. While they both experienced largely similar development paths marked by the macroeconomic stabilisation and market-building efforts in the 1990s followed by the EU accession, large capital inflows-driven growth and a sudden stop and internal-devaluation-based responses to the GFC in the 2000s, GMs of both countries became increasingly divergent in the decade after the GFC. Yet, the first two decades were also marked by incremental changes in economic specialisation and industrial, institutional and social class structures, amounting to the levels capable to shape further political choices and growth strategies. As a result, the countries transformed their GMs by more heavily relying on exports as a source of growth. However, the extent of this reliance but also export profiles differed significantly. While tradable and nontradable KIS became key drivers of growth in the Estonian GM, LT/MLT manufactured goods and non-KIS started to play a major role in the Lithuanian GM.
By adopting a weakly export-led GM, Estonia further strengthened its capacity to produce and export ICT-based KIS, therefore, it in many respects continued to follow a broader national development strategy of ICT-based leapfrogging into the group of advanced economies formulated at the onset of its independence. Indeed, during the recent two decades Estonia has moved much closer to realizing this vision by permeating all its socio-economic and political domains with digital technology, however the vision is not yet achieved. A large productivity gap from advanced economies suggests that while heavily specialising in ICT-based services, Estonia still occupies lover value added positions in their GVCs and faces difficulties to generate high returns from this specialisation.
As no particular economic specialisation played a bold role in the national development vision in Lithuania, it has naturally set itself on a more traditional manufacturing-based path-following development trajectory implying catching up with advanced economies through assimilating and adopting well established technologies and then gradually moving up the technological ladder. This trajectory manifests itself in the recent transformation of the Lithuanian GM. In contrast to Estonia, Lithuania started to rely on exports to a much larger extent. Thus, it experienced a more radical change of its GM from the one driven by debt-led private consumption before the GFC to another strongly export-led. At the core of the Lithuanian export-led GM is a strong capacity to export domestically produced LT/MLT manufactured goods and non-KIS such as land transportation services, however, this capacity to a large extent rests not on technological advancement but on cost- and institutional flexibility-based competitiveness in lower value-added segments of GVCs.
GMs differences between Estonia and Lithuania suggest a different nature of the MIT they might face. In this regard, the two countries resemble two policy misdiagnoses formulated by I. Gill and H. Kharas74 and Kenichi Ohno75. Estonia’s leapfrogging into the ICT specialisation is still uncapable to deliver significant productivity differences from other BS. Therefore, this leapfrogging might still be premature as some institutional deficiencies or a lack of institutional complementarities prevent Estonia from becoming an innovation-driven high-returns economy. Yet, Lithuania faces risks of continuously sustaining labour-intensive export-led growth by relying on cost competitiveness albeit growing wages. Therefore, instead of building stronger technological and product design capacities and consequently transiting to a higher stage of development of the manufacturing sector, Lithuania risks of further taking advantage of cost-competitiveness by diversifying into new “higher value-added” industries but still performing lower value-added activities in their GVCs.
On the policy recommendations side, the findings of the paper suggest that a “one size fits all” approach is hardly possible when it comes to recommendations for the BS on how to avoid the MIT. GMs of the BS have become increasingly different and the MIT poses very different risks to them. So typical recommendations such as more investment in R&D, higher social inclusion, better infrastructure, and more political reforms76 might be of little value unless adjusted to specific needs of each country. Yet, the current paper was capable to present only a surface view of these needs, therefore, they still must be studied in more details in the future.
References
Agénor, P. R. & O. Canuto. “Middle-Income Growth Traps.” In Policy Research Working Paper 6210 (2012). https://doi.org/10.1016/j.rie.2015.04.003
Aiyar, S., R. Duval, D. Puy, Y. Wu, & L. Zhang. “Growth Slowdowns and the Middle-Income Trap.” In IMF Working Paper: Vol. 13/71 (2013). https://doi.org/10.1016/j.japwor.2018.07.001
Akcay, Ü., E. Hein, & B. Jungmann. “Financialisation and Macroeconomic Regimes in Emerging Capitalist Economies Before and After the Great Recession.” International Journal of Political Economy 51 (2) (2022): 77–100. https://doi.org/10.1080/08911916.2022.2078009
Amable, B. Structural Crisis and Institutional Change in Modern Capitalism: French Capitalism in Transition. Oxford University Press, 2017.
Amable, B. & S. Palombarini. “A Neorealist Approach to Institutional Change and the Diversity of Capitalism.” Socio-Economic Review 7 (1) (2009): 123–143. https://doi.org/10.1093/ser/mwn018
Amable, B., A. Regan, S. Avdagic, L. Baccaro, J. Pontusson, & N. Van Der Zwan. “New Approaches to Political Economy.” Socio-Economic Review 17 (2) (2019): 433–459.
Atomico. The State of European Tech: The Most Comprehensive Data-driven Analysis of European Technology. (2020).
Baccaro, L. & J. Pontusson. “Social Blocs and Growth Models: An Analytical Framework with Germany and Sweden as Illustrative Cases.” In Unequal Democracies Working Paper N° 7 (Issue April) (2019).
Ban, C. & D. Adascalitei. “The FDI-led Growth Regimes of the East-Central and the South- East European Periphery.” In Diminishing Returns: The New Politics of Growth and Stagnation. Eds. M. Blyth, L. Baccaro, & J. Pontusson. Oxford University Press, 2022.
Bierut, B. K., & K. Kuziemska-Pawlak. “Competitiveness and Export Performance of CEE Countries.” Eastern European Economics 55 (6) (2017): 522–542. https://doi.org/10.1080/00128775.2017.1382378
Bohle, D. “Post-socialist Housing Meets Transnational Finance: Foreign Banks, Mortgage Lending, and the Privatization of Welfare in Hungary and Estonia.” Review of International Political Economy 21 (4) (2014): 913–948. https://doi.org/10.1080/09692290.2013.801022
Bohle, D., & A. Regan. “The Comparative Political Economy of Growth Models: Explaining the Continuity of FDI-Led Growth in Ireland and Hungary.” Politics & Society 49 (1) (2021): 75–106. https://doi.org/10.1177/0032329220985723
Bordāns, E. & M. Teinemaa. Baltic Tigers Facing the Middle-Income Trap? Stokholm School of Economics Riga, 2016.
Brixiova, Z., L. Vartia, & A. Wörgötter. “Capital Flows and the Boom-Bust Cycle: The Case of Estonia.” Economic Systems 34 (1) (2010): 55–72. https://doi.org/10.1016/j.ecosys.2009.11.002
Campos, N. F., F. Coricelli & L. Moretti. Economic Growth and Political Integration: Estimating the Benefits from Membership in the European Union Using the Synthetic Counterfactuals Method (IZA Discussion Paper, Issue 8162) (2014). https://doi.org/10.2139/ssrn.2432446
Detzer, D. “Inequality, Emulation and Debt: The Occurrence of Different Growth Regimes in the Age of Financialization in a Stock-Flow Consistent Model.” Journal of Post Keynesian Economics 41 (2) (2018): 284–315. https://doi.org/10.1080/01603477.2017.1387499
Dodig, N., E. Hein & D. Detzer. “Financialisation and the Financial and Economic Crises: Theoretical Framework and Empirical Analysis for 15 Countries.” In Financialisation and the Financial and Economic Crises: Country Studies. Eds. E. Hein, D. Detzer, & N. Dodig (pp. 1–41). Edward Elgar, 2016. https://doi.org/10.4337/9781785362385.00006
Doner, R. F. & B. R. Schneider. “The Middle-Income Trap: More Politics than Economics.” World Politics 68 (4) (2016): 608–644. https://doi.org/10.1017/S0043887116000095
Dünhaupt, P., & E. Hein. “Financialization, Distribution, and Macroeconomic Regimes before and after the Crisis: A Post-Keynesian View on Denmark, Estonia, and Latvia.” Journal of Baltic Studies 50 (4) (2019): 435–465.
EBRD. Eight Things You Should Know About Middle-Income Transitions (2018).
ECB. “The Impact of Global Value Chains on the Euro Area Economy.” Occasional Paper Series. (2019). https://doi.org/10.4337/9781848445017.00023
Eichengreen, B., D. Park & K. Shin. “Growth Slowdowns Redux.” Japan and the World Economy 32 (2014): 65–84. https://doi.org/10.1016/j.japwor.2014.07.003
European Commission. (2020a). Digital Economy and Society Index (DESI) 2020. Thematic chapters. https://ec.europa.eu/digital-single-market/en/desi
European Commission. (2020b). European Innovation Scoreboard 2020. https://ec.europa.eu/docsroom/documents/41887
European Commission. (2021a). Digital Economy and Society Index (DESI) 2021. Thematic chapters.
European Commission. (2021b). European Innovation Scoreboard 2021. https://doi.org/10.2873/340166
Fagerberg, J. & M. Srholec. “Capabilities, Competitiveness, Nations.” In The Challenges of Technology and Economic Catch-up in Emerging Economies. Eds. J.-D. Lee, K. Lee, D. Meissner, S. Radosevic, & N. Vonortas. Oxford University Press, 2021.
Felipe, J., A. Abdon, & U. Kumar. Tracking the Middle-income Trap: What Is It, Who Is in It, and Why? (Working Paper Collection, Issue 715) (2012).
Felipe, J., U. Kumar & R. Galope. “Middle-income Transitions: Trap or Myth?” Journal of the Asia Pacific Economy 22 (3) (2017). https://doi.org/10.1080/13547860.2016.1270253
Foxley, A. & F. Sossdorf. Making the Transition from Middle-Income to Advanced Economies (Issue September) (2011). http://www.crossref.org/deleted_DOI.html
Gereben, Á. & P. Wruuck. Towards a New Growth Model in CESEE:Cconvergence and Competitiveness through Smart, Green and Inclusive Investment (2021/01; EIB Working Paper) (2021). https://doi.org/10.4324/9780203067901.ch20
Gill, I. & H. Kharas. An East Asian Renaissance: Ideas for Economic Growth. World Bank, 2007. https://doi.org/10.1596/978-0-8213-6747-6
Gill, I. S. & H. Kharas. The Middle-Income Trap Turns Ten (No. 7403; Policy Research Working Paper) (2015).
Hall, P. A. “How Growth Regimes Evolve in the Developed Democracies.” 22nd International Conference of Europeanists, June. 2015.
Hancké, B. “The Political Economy of Wage-setting in the Eurozone.” In Wage Policy in the Eurozone. Ed. P. Pochet (pp. 131–148). Peter Lang Publishing, 2002.
Hassel, A., & B. Palier. “Tracking the Transformation of Growth Regimes in Advanced Capitalist Economies.” In Growth and Welfare in Advanced Capitalist Economies. Eds. A. Hassel & B. Palier (pp. 3–56). Oxford University Press, 2021. https://doi.org/10.1093/oso/9780198866176.003.0001
Hein, E. “Financialisation and Tendencies towards Stagnation: The Role of Macroeconomic Regime Changes in the Course of and after the Financial and Economic Crisis 2007–09.” Cambridge Journal of Economics 43 (4) (2019): 975–999. https://doi.org/10.1093/cje/bez022
Hein, E. & J. Martschin. “Demand and Growth Regimes in Finance-Dominated Capitalism and the Role of the Macroeconomic Policy Regime: A Post-Keynesian Comparative Study on France, Germany, Italy and Spain before and after the Great Financial Crisis and the Great Recession.” Review of Evolutionary Political Economy 2 (3), (2021): 493–527. https://doi.org/10.1007/s43253-021-00044-5
Hein, E., W. P. Meloni & P. Tridico. “Welfare Models and Demand-Led growth Regimes before and after the Financial and Economic Crisis.” Review of International Political Economy 0 (0) (2020): 1–36. https://doi.org/10.1080/09692290.2020.1744178
Im, F. G. & D. Rosenblatt. “Middle-Income Traps: A Conceptual and Empirical Survey.” In Policy Resaeaqrch Working Paper. 2013. https://doi.org/10.1142/S1793993315500131
IMF. (2009a). Republic of Estonia: Financial System Stability Assessment (Issue 09/89).
IMF. (2009b). Republic of Lithuania: Staff Report for the 2009 Article IV Consultation (Issue 09/322).
IMF. (2010). Does Lithuania have a Competitiveness Problem? (Lithuania, Selected Issues Paper, Issue Country Report No. 10/202).
Iversen, T., & D. Soskice. “Real Exchange Rates and Competitiveness: The Political Economy of Skill Formation, Wage Compression, and Electoral Systems.” American Political Science Review 104 (3) (2010): 601–623. https://doi.org/10.1017/S0003055410000304
Iversen, T., & D. Soskice, D. “An Structural-Institutional Explanation of the Eurozone Crisis.” In Paper presented at the Political Economy Workshop at the London School of Economics. 2013.
Jacoby, W. “Managing Globalization by Managing Central and Eastern Europe: The EU’s Backyard as Threat and Opportunity.” Journal of European Public Policy 17 (3) (2010): 416–432. https://doi.org/10.1080/13501761003661935
Kalanta, M. (2023). “Growth Model Change in Emerging Economies: Sectorial Growth Drivers, Politics and Institutions.” Forthcomming, 1–30.
Kattel, R. & I. Mergel. “Estonia’s Digital Transformation: Mission Mystique and the Hiding Hand.” In Great Policy Successes: How Governments get It Right in a Big Way at Least Some of the Time. Eds. M. Compton & P. ’t Hart (IIPP WP 2018-09; pp. 143–160). Oxford University Press, 2019.
Kattel, R. & R. Raudla. “Austerity that Never Was? The Baltic States and the Crisis.” In Levy Economics Institute of Bard College Policy Note (No. 5; Issue 5) (2012).
Kattel, R., & R. Raudla. “The Baltic Republics and the Crisis of 2008–2011.” Europe - Asia Studies 65 (3) (2013): 426–449. https://doi.org/10.1080/09668136.2013.779456
Kharas, H. & H. Kohli. “What Is the Middle Income Trap, Why do Countries Fall into It, and How Can It Be Avoided?” Global Journal of Emerging Market Economies 3 (3) (2011): 281–289. https://doi.org/10.1177/097491011100300302
Kohler, K. & E. Stockhammer. “Growing Differently? Financial Cycles, Austerity, and Competitiveness in Growth Models since the Global Financial Crisis.” Review of International Political Economy 29 (4) (2021): 1314–1341. https://doi.org/10.1080/09692290.2021.1899035
Krasjanovs, I. (2015). Is one foot of Latvian economy in the middle-income trap? (Bank of Latvia Working Papers).
Kuokštis, V. & R. Vilpišauskas. “Economic Adjustment to the Crisis in the Baltic States in Comparative Perspective.” 7th Pan-European International Relations Conference, 1–28 (2010).
Lee, J.-D., C. Baek & J.-I. Yeon. “Middle Innovation Trap: Capability Transition Failure and Stalled Economic Growth.” In The Challenges of Technology and Economic Catch-up in Emerging Economies. Eds. J.-D. Lee, K. Lee, D. Meissner, S. Radosevic, & N. Vonortas. Oxford University Press, 2021.
Lee, J.-D., K. Lee, D. Meissner, S. Radosevic & N. S. Vonortas. “Technology Upgrading and Economic Catch- Up: Context, Overview, and Conclusions.” In The Challenges of Technology and Economic Catch-up in Emerging Economies. Eds. J.-D. Lee, K. Lee, D. Meissner, S. Radosevic, & N. Vonortas. Oxford University Press, 2021.
Lee, K., & S. S. Ramanayake. “Adding-Up Problem and Wage–Productivity Gap in Exports of Developing Countries: A Source of the Middle-Income Trap.” The European Journal of Development Research 30 (5) (2018): 769–788. https://doi.org/10.1057/s41287-017-0124-1
Mertens, D., A. Nölke, M. Schedelik, C. May, T. Brink, A. de P. Gomes, M. Schedelik, T. Ten Brink, & A. de P. Gomes. Moving the Center: Adapting the Toolbox of Growth Model Research to Emerging Capitalist Economies (Issue 188) (2022).
Morkevičius, V., G. Žvaliauskas, A. Ambrulevičiūtė, & Z. Norkus. “Changes in Class Structures after the Great Recession: Estonia and Lithuania Compared.” Studies of Transition States and Societies 12 (2) (2020): 3–18.
Nakrošis, V., R. Vilpišauskas, & V. Kuokštis. “Fiscal Consolidation and Structural Reforms in Lithuania in the Period 2008–2012: From Grand Ambitions to Hectic Firefighting.” International Review of Administrative Sciences 81 (3) (2015): 522–540. https://doi.org/10.1177/0020852315581786
Notten, T. E. H. “The Role of Supply and Demand Factors for Lithuanian Exports: An ARDL Bounds Testing Approach.” Monetary Studies 2 (2012).
Ohno, K. (2009). The Middle Income Trap: Implications for Industrialization Strategies in East Asia and Africa.
Pesliakaitė, J., & T. Šiaudvytis. “Wage and Price Setting Behaviour of Lithuanian Firms: Survey-Based Evidence for 2008–2009 and 2010–2013.” In Bank of Lithuania Occasional Paper Series (No. 8; Issue 8) (2015).
Purfield, C. & C. B. Rosenberg. Adjustment under a Currency Peg: Estonia, Latvia and Lithuania during the Global Financial Crisis 2008–09 (WP/10/213; IMF Working Paper) (2010).
Radošević, S. & E. Yoruk. A New Metrics of Technology Upgrading: The Central and East European Countries in a Comparative Perspective (3.04; GRINCOH Working Paper). (2015). https://doi.org/10.13140/RG.2.1.5112.2646
Raudla, R. & R. Kattel. “Why did Estonia choose Fiscal Retrenchment after the 2008 Crisis?” Journal of Public Policy 31 (2) (2011): 163–186. https://doi.org/10.1017/S0143814X11000067
Spence, M. The Next Convergence: The Future of Economic Growth in a Multispeed World [Book]. Farrar, Straus and Giroux. 2011.
Staehr, K. (2015a). “Economic Growth and Convergence in the Baltic States: Caught in a Middle-Income Trap?” Intereconomics 50 (5): 274–280. https://doi.org/10.1007/s10272-015-0551-1
Staehr, K. (2015b). “Exchange Rate Policies in the Baltic States: From Extreme Inflation to Euro Membership.” CESifo Forum 4, 4.
Staehr, K. (Export Performance and Capacity Pressures in Central and Eastern Europe.” International Economics 165 (2021): 204–217. https://doi.org/10.1016/j.inteco.2020.12.008
Versli Lietuva. Baltijos šalių įsitraukimas į pasaulines pridėtinės vertės grandines: panašumai ir skirtumai. (2020).
Virbickas, E. “Wage and Price setting Behaviour of Lithuanian Firms.” In ECB Working Paper Series (No. 1198; Working Paper Series. Wage Dynamics Network). (2010).
World Bank. China 2030: Building a Modern, Harmonious, and Creative Society. World Bank, 2013.
Wren, A. “Strategies for Growth and Employment Creation in a Services-Based Economy.” In Growth and Welfare in Advanced Capitalist Economies. Eds. A. Hassel & B. Palier (pp. 255–288). Oxford University Press, 2021. https://doi.org/10.1093/oso/9780198866176.003.0008
1
2
3
4
5
6
7
8
9
10
11
12
13
14
15
16
17
18
19
20
21
22
23
24
25
26
27
28
29
30
31
32
33
34
35
36
37
38
39
40
41
42
43
44
45
46
47
48
49
50
51
52
53
54
55
56
57
58
59
60
61
62
63
64
65
66
67
68
69
70
71
72
73
74
75
76