Socialinė teorija, empirija, politika ir praktika ISSN 1648-2425 eISSN 2345-0266
2024, vol. 28, pp. 100–117 DOI: https://doi.org/10.15388/STEPP.2024.28.7
Is It Possible to Increase Fertility in Latvia in the Near Future?
Vera Komarova
Daugavpils University, Latvia
E-mail: vera.komarova@du.lv
https://orcid.org/0000-0002-9829-622X
Anita Sondore
Daugavpils University, Latvia
E-mail: anita.sondore@du.lv
https://orcid.org/0009-0004-0559-2305
Edmunds Čižo
Daugavpils University, Latvia
E-mail: edmunds.cizo@du.lv
https://orcid.org/0000-0003-0654-2962
Anita Kokarevica
Riga Stradins University, Latvia
E-mail: anita.kokarevica@rsu.lv
https://orcid.org/0000-0001-6173-0910
Abstract. This article aims to study the medium-term fertility trend in Latvia answering the following research question: is it possible to increase fertility in the near future, as planned in the “Population Reproduction Strategy FAMILY – LATVIA – 2030 (2050)”? The authors analyzed the total fertility rate (TFR) in Latvia for the period of 1970–2022 (53 years). This interdisciplinary (demography, mathematics, economics, sociology) study applies mathematical analysis for investigating socio-demographic trends, as well as the theory of economic cycles for identifying demographic cycles and their phases in Latvia and forecasting fertility rate in the near future. Furthermore, the analysis of data from comparative sociological surveys helped the authors to understand the main reason for the decline in fertility in Latvia. This reason is value changes in society, in which the child is no longer at the center of the value system of men and especially women in Latvia. In turn, short-term ups and downs in fertility are determined mainly by socio-economic and political factors. Based on the results of differentiating the function of the total fertility rate (TFR) it can be expected that the decline in fertility in Latvia will continue for several more years before the bottom of the next demographic cycle is reached and there will be an upturn in a linearly declining fertility trend. Although, the upcoming bottom will be lower than the previous one, i.e. below 1.22–1.25 children on average per woman and the next peak will most likely be below 1.74. Thus, the increase in TFR in Latvia to 1.77 by 2027, planned in the “Population Reproduction Strategy,” is considered by the authors of this study to be absolutely unattainable.
Keywords: total fertility rate (TFR), mathematical analysis, demographic cycles, economic cycles, value changes, Latvia.
Received: 2023-10-03. Accepted: 2024-04-26.
Copyright © 2024 Vera Komarova, Anita Sondore, Edmunds Čižo, Anita Kokarevica. Published by Vilnius University Press. This is an Open Access article distributed under the terms of the Creative Commons Attribution Licence, which permits unrestricted use, distribution, and reproduction in any medium, provided the original author and source are credited.
Introduction
On November 2022, the Latvian society was presented with the “Population Reproduction Strategy FAMILY – LATVIA – 2030 (2050)” (Interdepartmental Coordination Center, 2022), the main goal of which is clear from its title, namely, to promote the reproduction of the population of Latvia in the coming decades. As for specific figures, the Strategy envisages achieving the total fertility rate (TFR)1 of 1.77 children on average per woman by 2027, with an intermediate indicator of 1.72 in 2024, a base indicator of 1.61 in 2018 and a real indicator 1.57 in 2021 (Interdepartmental Coordination Center, 2022). In turn, in 2022 the TFR in Latvia was 1.47 children on average per woman (Central Statistical Bureau of the Republic of Latvia, 2023). Against the backdrop of real indicators, the goal put forward in the Strategy in relation to the level of fertility (1.77 children on average per woman by 2027) seems unrealistic. Latvian researcher in the field of demography, associate professor at the Riga School of Economics Z. Varpina has already called this Strategy “a letter to Santa Claus” (Latvia Television Program “Forbidden Technique”, 2023).
The purpose of this article is to study the medium-term fertility trend in Latvia in terms of TFR using tools of mathematical analysis. The main research question within this study: Is it possible to increase the TFR in Latvia in the near future, as planned in the “Population Reproduction Strategy”?
Since social processes never develop linearly, then, most likely, the analysis of the relevant indicators should not be linear, changes in the trajectory of the particular indicator have to be analyzed. To scientifically answer the question about the possibility of increasing the level of fertility in Latvia in the near future, the authors will conduct a mathematical analysis (Deshpande, 2004; Gedroica, 2005; Brannan, 2006; Volodko, 2007) of fertility trend in Latvia for the medium-term period 1970–2022 (53 years). This period includes two decades of the so-called “Soviet era,” as well as the period of Latvian independence after the collapse of the Union of Soviet Socialist Republics (USSR). The information base for this study is publicly available data from official Latvian statistics on TFR for the period 1970–2022 (Central Statistical Bureau of the Republic of Latvia, 2023).
Within this article, the authors will review scientific and media publications with the results of studying fertility trends in the modern world – in Europe and on other continents of the planet, then describe in more detail the research methodology, the methods and tools used. Next, the research results will be analyzed and discussed, and at the end of the article, the authors will offer their conclusions and a scientifically based answer to the research question of whether it is possible to increase fertility in Latvia in the near future.
Review of publications on fertility trends in the modern world
In different countries and regions of the modern world, many researchers and international organizations state and analyze changes in fertility determined by social, economic, cultural and medical factors (Mubila, 2012; Adhia, 2018; McDonald, 2020; Pourreza et al., 2021; Skirbekk, 2022; World Economic Forum, 2022; Kearney & Levine, 2022). A general trend towards a decrease in fertility is observed in many countries of the modern world (Skirbekk, 2022; World Economic Forum, 2022), but there are exceptions, especially in developing regions (Adhia, 2018; Pourreza et al., 2021; World Economic Forum, 2022). In general, the results of studying fertility trends in the modern world (in Europe and on other continents of the planet) can be grouped into several blocks that describe and analyze the most current phenomena and processes in the field of fertility.
The first, important and generally recognized process is the decline in fertility rate in almost all developed countries of the modern world (Zitmane & Lāma, 2023; Tretjakova et al., 2020; Adhia, 2018; McDonald, 2020; Kearney & Levine, 2022). Furthermore, in less developed countries, fertility trends are also directed towards decreasing (Mubila, 2012; Pourreza et al., 2021). Thus, in India, 50 years ago there were 5.59 children on average per woman, but in 2020 there were only 2.18 (United Nations Department of Economic and Social Affairs, 2022). This is the global picture – the TFR curves in almost all countries of the world are going down (United Nations Department of Economic and Social Affairs, 2022). Demographers believe that one of the main reasons for the global decline in fertility is the increased education of people around the world and a more conscious approach to their actions, which invariably leads to a decrease in fertility on all continents of the planet, including Asia and Africa (Skirbekk, 2022). In Europe, the already low fertility is also decreasing. According to Eurostat, in 2010, six European countries were still on the threshold of sub-replacement fertility (about 2.1 children on average per woman during her lifetime) – France, Iceland, Ireland, Norway, Sweden, Great Britain, but ten years later, in 2020, no any European country reached the target of 2 children on average per woman (Eurostat, 2023a). As for Latvia, in terms of the TFR it is in the middle of the list of European countries (Eurostat, 2023a). The main factors for a sustainable decline in fertility in the modern world are considered to be the following: an increase in the number of women striving for a career and education, later marriage, access to contraception and changes in socio-cultural norms (Skirbekk, 2022; World Economic Forum, 2022).
The next important phenomenon associated with fertility trends and widely covered in scientific and analytical publications around the world is the demographic transition that many countries of the modern world are going through. The demographic transition (changes in fertility and mortality rates in connection with economic development and socio-cultural changes) has several stages, at one of which the fertility rate begins to decline (after the mortality rate has decreased). The decline in fertility below the level of simple generation replacement in economically developed countries of the world occurred in the second half of the 20th century (Skirbekk, 2022). At the end of the 1980s, the concept of the second demographic transition was introduced into scientific circulation (Van de Kaa, 1987), which is still widely used in the analysis of demographic development (Sobotka, T. 2008; Krūmiņš & Krišjāne, 2016; Lesthaeghe, 2020). The outstanding Latvian demographer P. Zvidrins, in his article on the dynamics of the level of fertility in Latvia, analyzed the changes that have occurred in fertility over the past 100 years. The results of his research showed that the decline in fertility in Latvia, as well as in neighboring Estonia, began earlier than in other parts of the then Russian Empire (Zvidrins, 1979). The demographic transition from the so-called traditional type of population reproduction, characterized by high birth and death rates, began in Western Europe at the end of the 18th century. In turn, in the territory of Latvia and Estonia, the beginning of this process dates back to the middle of the 19th century (Krūmiņš, 2019).
In turn, demographer D. Coleman, analyzing ethnic and social transformations as a result of immigration in a number of European countries and the United States, proposed using the concept of the third demographic transition as a theoretical basis for explaining new socio-demographic trends (Coleman, 2006). He takes a third demographic transition as distinct from the second one: “the ancestry of some national populations is being radically and permanently altered by high levels of immigration of persons from remote geographic origins or with distinctive ethnic and racial ancestry, in combination with persistant sub-replacement fertility and accelerated levels of emigration of the domestic population” (Coleman, 2006). As for modern Latvia, J. Krumins and Z. Krisjane concluded that the socio-demographic situation in Latvian society is characterized by the features of the second demographic transition (decrease in fertility to levels close to or even below sub-replacement fertility) with a focus towards the third demographic transition (a further decrease in fertility to the lowest levels) (Krūmiņš & Krišjāne, 2016).
The third important phenomenon, which is the subject of many scientific publications and analytical reports of international organizations, is the factors that determine fertility trends in the modern world. In general, the authors of this study can identify the following five groups of factors mentioned and analyzed in the world scientific and analytical literature on fertility (May, 2012; Mubila, 2012; Adhia, 2018; McDonald, 2020; Tretjakova et al., 2020; Pourreza et al., 2021; Skirbekk, 2022; World Economic Forum, 2022; Kearney & Levine, 2022; Norgėlaite, 2022; United Nations Department of Economic and Social Affairs, 2022): (1) policy factors; (2) economic factors; (3) opportunities for parents; (4) cultural and value factors; (5) technological progress in medicine; (6) level of education.
As the results of many studies show, the synergy of several determining factors leads to changes in fertility trends, and single-factor explanations are unlikely to be useful for explaining complex socio-demographic processes influenced by various structural and ideological changes (Lesthaeghe, 2020). Furthermore, the general background against which a particular factor determining fertility operates is also important, since none single political instrument will work if the country does not have a favorable socio-economic and political environment for its implementation (May, 2012; Latvia Television Program “Forbidden Technique”, 2023).
The results of the review of publications on fertility trends in the modern world showed that usually the analysis of these trends is descriptive (Eglīte, 2011; Mežs, 2011; Bērziņš, 2019; McDonald, 2020; Interdepartmental Coordination Center, 2022) – for example, “the TFR shows the most favorable situation in the 1980s and the lowest level of population reproduction in the second half of the 1990s” (Bērziņš, 2019 – about Latvia); “in Latvia, there is even an increase in fertility – from 1.36 children on average per one woman in 2010 to 1.55 children in 2020” (Interdepartmental Coordination Center, 2022). Such a descriptive approach to the analysis of fertility trends, firstly, is rather superficial, without a detailed formalized analysis and understanding of the phenomenon of fertility in dynamics, and secondly, does not make it possible to scientifically answer the main research question of this study. The authors of this article hope to fill this methodological gap in demographic research through a mathematical analysis of the fertility trend in Latvia for the medium-term period 1970–2022 (53 years).
Research methodology
Mathematical analysis is useful in demographic and social studies as a tool for studying the structure and dynamics of society. Using mathematical models of socio-demographic processes, it is possible to forecast the further development of these processes (Deshpande, 2004) – for example, it is possible to forecast the fertility rate in a particular country. At the same time, the methodological premise is accepted that the factors determining fertility interact with each other (in some years the economic factor is stronger, in some years the cultural-value factor is stronger, etc.) and lead to a certain fertility rate in a given year, but with the help of mathematical analysis tools, the authors examine fertility indicators themselves. Thus, the authors conduct mainly technical rather than fundamental data analysis (Sherry C. J. & Sherry, J. W., 2000; Hilkevics & Pulkstene, 2019), considering changes “in themselves,” without statistical analysis of the factors influencing them (although the topic of factors determining fertility in Latvia will also be touched upon within the analysis and discussion of the results of this study).
To obtain a mathematical model of the nonlinear process of changes in the level of fertility in Latvia over several decades, i.e. to compile the formula for the TFR function for several dozen points using the least squares method (LSM), the authors use data approximation with an n-th degree polynomial (Brannan, 2006):
f(x) = a0 + a1x + a2x2 + ... + anxn (1)
where:
f(x) is an approximating function;
a0, a1, a2 , ..., an are coefficients to be found (a0 is the value of the free term, indicates the value of y at x = 0, i.e. this is the initial level of fertility at the beginning of the period under study);
x is an independent variable.
The main idea of approximation is to find the function that best fits the observed data (Volodko, 2007): in our case, data on TFR in Latvia over the last half century. This allows you to replace a complex function with a simpler one and simplify mathematical calculations and data analysis. To achieve the goal of this study, the authors chose the polynomial type of interpolation as the most suitable way of the approximation. It consists in constructing a function that passes through given points and approximates the function values at intermediate points (Deshpande, 2004). For a more accurate assessment and interpretation of the polynomial function, the authors use its additional analysis (in particular, they differentiate the function, i.e. define and analyze its derivatives at each point corresponding to each year of the period under study) (Gedroica, 2005) and visualization of the medium-term (53 years) fertility trend in Latvia.
It should be noted that methodologically, even a simple comparison of the TFR indicators between specific years can give an idea of how the level of fertility has changed over different periods of time. In turn, the analysis of derivatives’ values allows you to identify more subtle trends and periods of change, which may be less obvious when simply comparing TFR values (Gedroica, 2005; Brannan, 2006). Differentiating a function (defining and analyzing its derivatives) can also help to identify the exact moments of a trend change, for example, the exact year when fertility first began to fall or rise.
For a function of type f(x) = a0 + a1x + a2x2 + ... + anxn (Formula 1), where n is the degree of the polynomial, and a0, a1, a2, …, an are the coefficients, the derivative at each point x will be calculated using the rule for differentiating the degree function xn (Gedroica, 2005):
dy/dx(xn) = nxn–1 (2)
Since a polynomial function can have different slopes in different parts of its graph, calculating the derivatives of the function at each point x allows you to find out the speed of change of the function values depending on the change in the variable x. The smaller the absolute value of the derivative, the slower the fertility rate changes in the vicinity of a particular point (Gedroica, 2005; Brannan, 2006). If the derivative is negative at a certain point, this means that as the value of x at that point increases, the value of the function decreases. Graphically, this means that the graph of the function goes “down” or has a decreasing slope at this point. Conversely, if the derivative is positive at a point, then the function is increasing (has a positive slope) at that point. The graph of the function will go “up” or have an increasing slope at this point (Gedroica, 2005; Brannan, 2006).
Empirically interpreting the derivatives of the TFR approximating function, there are situations that are paradoxical at first glance, when the fertility rate increases, and the derivative of the approximating function (a speed of change) is negative. This situation occurs quite often and has the following logical explanation: the derivative of the approximating function reflects the speed of change in the fertility trend in the vicinity of a certain point; if the derivative is negative, this means that a downward trend in fertility rates has already begun. In other words, if the derivative of the approximating function is negative, the fertility rate may increase, but more slowly. As a result, in a given year the TFR may still be higher than in the previous year, but the growth is slowing down
Accordingly, the situation when the TFR is decreasing, and the derivative of the approximating function is positive, has the following logical explanation: the positive derivative of the approximating function (a speed of change) may indicate the onset of a trend when the fertility rate begin to increase, although statistical data still indicate a decrease in the TFR. We can say that the fertility rate is changing in a positive direction, i.e. the decline is slowing down. Such situations are a good example of how important it is to consider not only the values of the TFR function, but also its derivatives for a more complete understanding of the dynamics of changes in fertility in the general trend.
Research results, their analysis and discussion
The authors will begin the mathematical analysis of the fertility trend in Latvia for the medium-term period 1970–2022 (53 years) with a simple presentation of the initial statistical data on the TFR for 1970–2022.
Table 1. Total fertility rate (TFR), number of children on average per woman during her life, 1970–2022, Latvia
|
Year |
TFR |
Year |
TFR |
Year |
TFR |
Year |
TFR |
|
1970 |
2.01 |
1984 |
2.14 |
1998 |
1.12 |
2012 |
1.44 |
|
1971 |
2.03 |
1985 |
2.08 |
1999 |
1.18 |
2013 |
1.52 |
|
1972 |
2.05 |
1986 |
2.21 |
2000 |
1.25 |
2014 |
1.65 |
|
1973 |
1.96 |
1987 |
2.21 |
2001 |
1.22 |
2015 |
1.70 |
|
1974 |
1.99 |
1988 |
2.16 |
2002 |
1.25 |
2016 |
1.74 |
|
1975 |
1.96 |
1989 |
2.04 |
2003 |
1.32 |
2017 |
1.69 |
|
1976 |
1.93 |
1990 |
2.00 |
2004 |
1.29 |
2018 |
1.60 |
|
1977 |
1.88 |
1991 |
1.86 |
2005 |
1.39 |
2019 |
1.61 |
|
1978 |
1.86 |
1992 |
1.74 |
2006 |
1.46 |
2020 |
1.55 |
|
1979 |
1.86 |
1993 |
1.52 |
2007 |
1.54 |
2021 |
1.57 |
|
1980 |
1.88 |
1994 |
1.41 |
2008 |
1.58 |
2022 |
1.47 |
|
1981 |
1.88 |
1995 |
1.27 |
2009 |
1.46 |
- |
- |
|
1982 |
1.97 |
1996 |
1.18 |
2010 |
1.36 |
- |
- |
|
1983 |
2.12 |
1997 |
1.13 |
2011 |
1.33 |
- |
- |
Source: compiled by the authors based on data from Central Statistical Bureau of the Republic of Latvia, 2023.
Just a superficial glance at the data presented in Table 1 confirms that social processes never develop linearly. In the case of the TFR in Latvia over the last half century, one can also see a constant alternation of growth and decline in fertility, which requires formalized mathematical analysis rather than a simple description.
In accordance with the methodology of this study, described in the previous section of the article, the first step in analyzing the fertility trend in Latvia for the medium-term period 1970–2022 (53 years) will be the approximation of the data (Deshpande, 2004), as a result of which the following mathematical model of changes in the TFR in Latvia for the last half century was created:
y = 0.0097x6 – 0.1751x5 + 1.1776x4 – 3.599x3 + 4.8292x2 – 2.393x + 2.2168 (3)
where:
y is the approximating function’s value;
x is the year rank within the 53-year period (0 corresponds to 1970, 0.1, 0.2, ..., 5.2 corresponds to 2022).
Source: calculated by the authors in MS Excel based on data from Central Statistical Bureau of the Republic of Latvia, 2023.
Thus, the approximating mathematical model of changes in fertility in Latvia over the last half century is a polynomial function of the sixth degree, which means that the relationship between the variables (in our case, between the TFR and the year rank within the period 1970–2022) is complex and contains nonlinear effects (Gedroica, 2005). The determination coefficient R2 is equal to 0.8463; this indicates a good quality of approximation: the proportion of variance over time in the TFR explained by the approximating mathematical model (Formula 3) is almost 85%. The identification of the statistical significance of the determination coefficient R2 was performed by testing the null hypothesis of the Fisher F-statistics. The calculated value Ffact = 42.2 at 1% significance level, which is greater than the critical value Fcr = 4.3E-17. The null hypothesis about the inconsistency of the equation obtained as a result of approximation is rejected. The determination coefficient R2 is statistically significant and can be used to assess the quality of the resulting mathematical model (Revina, 2002).
From the approximating mathematical model of changes in the TFR in Latvia over the last half century (Formula 3), the following can be concluded: since the polynomials have several extrema (maxima and minima) and bends in the graph, then the medium-term fertility trend in Latvia has several local maxima and minima. This means that the medium-term fertility trend in Latvia is nonlinear. The fluctuations in the fertility rates, repeated over time, resemble economic cycles or cycles of economic activity (Ovechkina & Shulgina, 2012; StudySmarter, 2023) and characterize only short-term cyclical changes that periodically replace each other: an increase in the TFR is followed by its decrease, then an increase again, etc., regardless of changes in political regimes and economic conditions.
For the polynomial n-th degree function obtained as a result of the TFR data approximation within the time period 1970–2022, the formula for calculating derivatives is as follows:
dy/dx = 0,0582x5 – 0,8755x4 + 4,7104x3 – 10,797x2 + 9,6584x – 2,393 (4)
where:
dy/dx is the derivative with respect to the argument x for the approximating function y from formula 3;
x is the year rank within the 53-year period (0 corresponds to 1970, 0.1, 0.2, ..., 5.2 corresponds to 2022).
Source: the authors’ calculated based on Formula 3 and the rule of differentiation of the degree function (xn) (Gedroica, 2005).
The following table shows changes in the TFR and derivatives of the fertility function in Latvia over the time period 1970–2022, and also provides an empirical interpretation – in relation to fertility – of changes in values of the derivatives.
The data in Table 2, as well as the graph in Figure 1, show the cyclical nature of the medium-term fertility trend in Latvia, which, however, has a generally decreasing slope – from a TFR of 2.01 children on average per woman in 1970 to 1.47 children in 2022. Furthermore, in the analyzed medium-term period of changes in the fertility rate in Latvia, there were quite often periods of apparent contradiction described in the methodological section of this study, when the fertility rate increased, and the derivative of the function (a speed of change) was negative (for example, 1970–1971, 1983–1984) and the opposite situations – when the fertility rate decreased, and the derivative of the approximating function was positive (for example, 2003–2004, 2009–2010).
Table 2. Changes in the total fertility rate (TFR) and derivatives of the approximating function, 1970–2022, Latvia
|
Year |
Total fertility rate (TFR) |
Change in the TFR compared with the previous year |
Value of the derivative of the approximating function |
Relative change* |
Empirical interpretation of changes in value of the derivative |
|
1970 |
2.01 |
- |
-2.3930 |
- |
Previous growth in fertility is slowing (in 1965 the total fertility rate was 1.74) |
|
1971 |
2.05 |
0.04 |
-1.5305 |
36.0 |
|
|
1972 |
2.03 |
-0.02 |
-0.8569 |
44.0 |
|
|
1973 |
1.96 |
-0.07 |
-0.3469 |
59.5 |
|
|
1974 |
1.99 |
0.03 |
0.0225 |
106.5 |
Fertility growth slowed down as much as possible and turned in the direction of fertility decline |
|
1975 |
1.96 |
-0.03 |
0.2729 |
1111.7 |
|
|
1976 |
1.93 |
-0.03 |
0.4236 |
55.2 |
Fertility decline trend continues, but is slowing |
|
1977 |
1.88 |
-0.05 |
0.4926 |
16.3 |
|
|
1978 |
1.86 |
-0.02 |
0.4958 |
0.7 |
Fertility decline has stopped and turned towards growth |
|
1979 |
1.86 |
0.00 |
0.4477 |
-9.7 |
|
|
1980 |
1.88 |
0.02 |
0.3614 |
-19.3 |
Fertility growth trend continues, but is slowing |
|
1981 |
1.88 |
0.00 |
0.2481 |
-31.3 |
|
|
1982 |
1.97 |
0.09 |
0.1181 |
-52.4 |
|
|
1983 |
2.12 |
0.15 |
-0.0200 |
-116.9 |
Fertility growth has stopped and fertility decline trend began |
|
1984 |
2.14 |
0.02 |
-0.1587 |
-694.3 |
|
|
1985 |
2.08 |
-0.06 |
-0.2917 |
-83.8 |
Fertility decline trend continues, but is slowing (a short-term fertility rise in 1986–87 did not change the overall downward trend) |
|
1986 |
2.21 |
0.13 |
-0.4139 |
-41.9 |
|
|
1987 |
2.21 |
0.00 |
-0.5212 |
-25.9 |
|
|
1988 |
2.16 |
-0.05 |
-0.6104 |
-17.1 |
|
|
1989 |
2.04 |
-0.12 |
-0.6794 |
-11.3 |
|
|
1990 |
2.00 |
-0.04 |
-0.7268 |
-7.0 |
|
|
1991 |
1.86 |
-0.14 |
-0.7521 |
-3.5 |
|
|
1992 |
1.74 |
-0.12 |
-0.7552 |
-0.4 |
|
|
1993 |
1.52 |
-0.22 |
-0.7371 |
2.4 |
|
|
1994 |
1.41 |
-0.11 |
-0.6990 |
5.2 |
|
|
1995 |
1.27 |
-0.14 |
-0.6426 |
8.1 |
|
|
1996 |
1.18 |
-0.09 |
-0.5703 |
11.2 |
|
|
1997 |
1.13 |
-0.05 |
-0.4847 |
15.0 |
|
|
1998 |
1.12 |
-0.01 |
-0.3885 |
19.8 |
|
|
1999 |
1.18 |
0.06 |
-0.2849 |
26.7 |
|
|
2000 |
1.25 |
0.07 |
-0.1771 |
37.8 |
|
|
2001 |
1.22 |
-0.03 |
-0.0684 |
61.4 |
Fertility decline has stopped and fertility growth trend began |
|
2002 |
1.25 |
0.03 |
0.0379 |
155.4 |
|
|
2003 |
1.32 |
0.07 |
0.1385 |
265.7 |
Fertility growth trend continues, but is slowing (the short-term fertility decline in 2009–10 did not change the overall growth trend) |
|
2004 |
1.29 |
-0.03 |
0.2304 |
66.3 |
|
|
2005 |
1.39 |
0.10 |
0.3106 |
34.8 |
|
|
2006 |
1.46 |
0.07 |
0.3766 |
21.2 |
|
|
2007 |
1.54 |
0.08 |
0.4260 |
13.1 |
|
|
2008 |
1.58 |
0.04 |
0.4570 |
7.3 |
|
|
2009 |
1.46 |
-0.12 |
0.4682 |
2.5 |
|
|
2010 |
1.36 |
-0.10 |
0.4588 |
-2.0 |
|
|
2011 |
1.33 |
-0.03 |
0.4286 |
-6.6 |
|
|
2012 |
1.44 |
0.11 |
0.3780 |
-11.8 |
|
|
2013 |
1.52 |
0.08 |
0.3084 |
-18.4 |
|
|
2014 |
1.65 |
0.13 |
0.2219 |
-28.1 |
|
|
2015 |
1.70 |
0.05 |
0.1214 |
-45.3 |
|
|
2016 |
1.7 |
0.04 |
0.0109 |
-91.0 |
Fertility growth stopped at 1965 rate (1.74) and fertility decline trend began |
|
2017 |
1.69 |
-0.05 |
-0.1045 |
-1055.2 |
|
|
2018 |
1.60 |
-0.09 |
-0.2187 |
-109.3 |
Fertility decline trend continues, but is slowing |
|
2019 |
1.61 |
0.01 |
-0.3245 |
-48.3 |
|
|
2020 |
1.55 |
-0.06 |
-0.4132 |
-27.3 |
|
|
2021 |
1.57 |
0.02 |
-0.4749 |
-14.9 |
|
|
2022 |
1.47 |
-0.10 |
-0.4984 |
-4.9 |
* Calculation of percentage changes in value of the derivative of the fertility function compared to the previous year is necessary in order to take into account both absolute and relative differences between values of the derivative and to reduce the effect of a purely mathematical relationship between values of the function and its derivative associated with changes in the variable x.
Source: calculated in Excel and compiled by the authors based on data from Central Statistical Bureau of the Republic of Latvia, 2023.
As already noted in the methodological section of this study, such situations are a good example of how important it is to consider not only the values of the approximating function, but also its derivatives for a more complete understanding of the dynamics of changes in fertility within the general trend. For example, the negative value of the derivative of the approximating function in 1970–1971 with a simultaneous increase in the fertility rate indicated that the previous growth was slowing down (in 1965 the TFR was 1.74 (Central Statistical Bureau of the Republic of Latvia, 2023)), and the negative derivative with an increase in the fertility rate in 1983–1984 indicated– that growth has stopped and fertility decline trend has begun.
Table 3. Identification of different phases of demographic cycles, 1970–2022, Latvia
|
Time period |
Empirical interpretation of changes in the values of derivatives |
Duration of phases of demographic cycles |
Name of phases of demographic cycles |
|
1970–1973 |
The previous growth in fertility is slowing (1.74 in 1965, 1.96 in 1973) |
4 years falling within the study period 1970–2022 |
Growth (expansion) |
|
1974–1975 |
Fertility growth slowed down as much as possible and turned in the direction of fertility decline (1.99–1.96) |
2 years |
Peak or boom |
|
1976–1977 |
Fertility decline trend began, with the speed of decline slowing (1.93–1.88) |
2 years |
Decline (recession) |
|
1978–1979 |
Fertility decline has stopped and turned towards growth (1.86 in both 1978 and 1979) |
2 years |
Bottom (depression) |
|
Next demographic cycle |
|||
|
1980–1982 |
Fertility growth trend continues, but is slowing (1.88–1.97) |
3 years |
Growth (expansion) |
|
1983–1984 |
Fertility growth has stopped and fertility decline trend began (2.12–2.14) |
2 years |
Peak or boom |
|
1985–2000 |
Fertility decline trend continues, but is slowing (the short-term rise in fertility in 1986–1987 as a result of M. Gorbachev’s anti-alcohol campaign did not change the general downward trend) (2.08–1.25) |
16 years |
Decline (recession) |
|
2001–2002 |
Fertility decline has stopped and fertility growth trend began (1.22–1.25) |
2 years |
Bottom (depression) |
|
Next demographic cycle |
|||
|
2003–2015 |
Fertility growth trend continues, but is slowing (1.32–1.70); this period saw a sharp short-term decline in 2009–2010 as a result of the shock of the 2008 global financial crisis (1.46–1.36) |
13 years |
Growth (expansion) |
|
2016–2017 |
Growth stopped at the 1965 level (1.74), and fertility decline trend began |
2 years |
Peak or boom |
|
2018–2022 |
Fertility decline trend continues, but is slowing (1.69–1.47) |
5 years |
Decline (recession) |
|
The immediate forecast is that the decline will continue for several more years before the bottom of the next cycle is reached (this bottom will be lower than the previous one, i.e. below 1.22–1.25) and there will be a turn towards fertility growth as a part of the long-term declining fertility trend. Thus, the next growth will not reach the previous peak, i.e. the next peak will most likely be below 1.74 |
|||
Source: compiled by the authors based on data from Table 2.
In the following table, the authors identified the various phases of demographic cycles in Latvia, using an analogy with the phases of economic cycles – growth (expansion), peak or boom, decline (recession), bottom (depression) (StudySmarter, 2023). The authors also tried to forecast the fertility trend in Latvia in the near future.
As the main results of the authors’ mathematical analysis of the medium-term fertility trend in Latvia show (Tables 2 and 3), there are empirically based demographic cycles that are very similar to economic cycles (and even related to them – Ovechkina & Shulgina, 2012), well developed in macroeconomic theory (StudySmarter, 2023). From the point of view of demography, the historical process is a sequence of demographic cycles, and the mirror image of demographic cycles are cyclical changes in per capita consumption, that is, cycles of real wages or income (Ovechkina & Shulgina, 2012).
The authors asked whether the cyclical fertility trend in Latvia is similar to fertility trends in other countries? The following figure compares fertility trends in the neighboring Baltic countries over the same 53-year period.
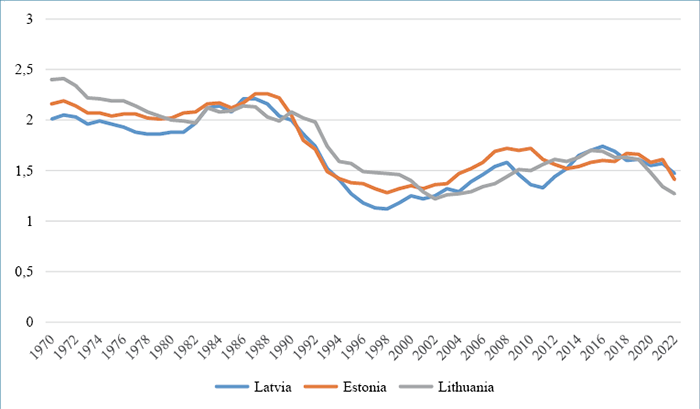
Figure 1. Comparison of fertility trends in the Baltic countries, the total fertility rate (TFR), 1970–2022
Source: created by the authors based on data from Central Statistical Bureau of the Republic of Latvia, 2023; Statistics Estonia, 2023; Statistics Lithuania, 2023; World Bank, 2023.
Figure 1 shows that the fertility trends in Lithuania and Estonia are similar to the fertility trend in Latvia in their cyclical nature and overall decline in TFR. This allows the authors to draw a conclusion about demographic cyclicality (and not linearity, as is the case, for example, in Eurostat TFR forecasts for Lithuania (Eurostat, 2023b)).
The authors of this stud consider that the main reason for the impossibility of increasing fertility in Latvia (and probably in Lithuania and Estonia, too) in the near future is value changes in society, which are actively studied by sociologists and demographers in Latvia, Lithuania and other countries. In Soviet era the ideal family model was considered to be a family with two children (both large families and childlessness were rare) (Zvidrins, 1979), and this ensured the achievement of fertility rates close to 2. Nowadays, as Z. Varpinya argued, “family still has value (family safety, health of loved ones), but a child is no longer the only and necessary means of realizing one’s life ambitions. He is no longer at the center of the value system” (Latvia Television Program “Forbidden Technique”, 2023). As the results of a comparative sociological “Study of factors contributing to marriage, fertility and positive parent–child relationships” (2004 (n = 1970 people) and 2022 (n = 2297 people), Latvia) conducted by the University of Latvia show that in 2004, women rated the statement “a child gives meaning to life” on average at 4.36 (on a 5-point scale), and men at 4.32; in 2022, these rates dropped to 3.42 for women and 3.44 for men (Pirsko et al., 2022).
Table 3. Hierarchies of values, 2004 (n = 1970 people) and 2022 (n = 2297 people), Latvia
|
Values |
Rank in the hierarchy of values, 2004 |
Rank in the hierarchy of values, 2022 |
Values |
|
Family safety (safety of loved ones) |
1 |
1 |
Family safety (safety of loved ones) |
|
Health (no physical or mental illness) |
2 |
2 |
Health (no physical or mental illness) |
|
Children and family (as an intrinsic value) |
3 |
3 |
Peace in the whole world (without wars and conflicts) |
|
Inner harmony |
4 |
4 |
Freedom (freedom of action and thought) |
|
Mature love |
5 |
5 |
Inner harmony |
|
Self-esteem |
6 |
6 |
Self-esteem |
|
Sincere friendship |
7 |
7 |
Honesty |
|
Freedom (freedom of action and thought) |
8 |
8 |
Intelligence |
|
Intelligence |
9 |
9 |
Country safety (protecting my people from enemies) |
|
Honesty |
10 |
10 |
Sincere friendship |
|
Peace in the whole world (without wars and conflicts) |
11 |
11 |
Mature love |
|
… |
|||
|
Country safety (protecting my people from enemies) |
24 |
22 |
Children and family (as an intrinsic value) |
Source: Pirsko et al., 2022: 57.
The authors of the review of the results of the above-mentioned study commented on the significant decline in the place of children and families in the hierarchy of values of Latvian society: “this result allows us to conclude that with a decrease in the self-worth of children and families, one can expect that people will make less effort to achieve this values, i.e. they will be less willing to create families and have children” (Pirsko et al., 2022). The current tendency among young people not to put in extra effort (in the following case – to work) is also evidenced by the results of an international survey conducted by the recruiting company Randstad Deutschland of 35,000 young people aged from 18 to 24 years. 58% of respondents said that they would leave their job if it interfered with their enjoying life, and 38% have already done this at least once. Many HR managers in Western (and not only Western) companies complain that young people do not want to take responsibility, do not want to work a full 5 days a week, and in every possible way avoid “overtime” (Baumeister, 2023).
Researchers of the phenomenon of female childlessness in Lithuania, based on the results of a comparative survey of women of two generations, concluded that “the subjectively perceived causes of childlessness revealed different ways the two generations of women experience childlessness. ... In terms of voluntary childlessness, the differences among women of the two generations are prominent. Older women never openly say that they have chosen to remain childless, even though they admit never really wanting children. In contrast, younger women are not afraid to declare that they chose to be childfree and are enjoying it” (Tretjakova et al., 2020).
The authors agree with M. Navickiene, Lithuanian Minister of Social Security and Labour, who believes that the government would increase benefits if it thought it would have an effect, but in reality financial measures are less of a factor in a family’s decision to have children than good infrastructure to raise them (LRT TV, 2023). “All the studies confirm the same thing, that the decision to have children is not made because of benefits … Lithuania is already one of the most generous EU member states when it comes to maternity payouts” (LRT TV, 2023). According to M. Navickiene, a more important factor for young families is opportunities to resume their careers following parental leave and balance work and family responsibilities (LRT TV, 2023).
Conclusions
Based on the results of mathematical analysis of the medium-term fertility trend in Latvia, it can be expected that the decline of TFR will continue for several more years before the bottom of the next demographic cycle is reached (this bottom will be lower than the previous one, i.e. less than 1.22–1.25 children on average per woman) and there will be a reversal in fertility rates within the long-term declining fertility trend (this rise will not reach the previous peak, i.e. the next peak will most likely be less than 1.74 children on average per woman). Thus, the expected by the creators of the “Population Reproduction Strategy” increase in fertility in Latvia to the level of 1.77 children on average per woman by 2027 (with an intermediate indicator of 1.72 children on average per woman in 2024) is considered by the authors of this study absolutely unattainable under any realistically feasible socio-economic and political conditions in the country.
As for the set of reasons for fertility changes in Latvia, the authors believe that short-term ups and downs in fertility are determined mainly by socio-economic and political factors – for example, fertility rise in 1986–1987 as a result of M. Gorbachev’s anti-alcohol campaign or fertility collapse in 2009–2010 as a result of the shock of the 2008 global financial crisis. Such short-term ups and downs do not entail general changes in the current phase – growth or decline – of the demographic fertility cycle. In turn, fundamental changes in the fertility trend are most likely determined by value changes in society. Furthermore, the cult of enjoying life that is spreading in the modern world does not fit well with caring for children and, according to the authors of this study, is the value basis for the steadily declining fertility rate – both in Latvia and in other countries of Europe and the world.
The conception of demographic cycles used by the authors of this study, allows to argue that the time period of 53 years studied within this article is most likely a part of longer-term demographic cycle, which was not covered by this study and thereby limited the application of its results in a longer term – for example, in the future 100 years or more.
References
Adhia, N. (2018). Some demographic trends in the world’s most populous country-to-be. Demographics, Social Policy, and Asia (Part II), 23(2), https://www.asianstudies.org/wp-content/uploads/some-demographic-trends-in-the-worlds-most-populous-country-to-be.pdf
Baumeister, А. (2023, October 5). Do not work! Be lazy and enjoy life! YouTube. https://www.youtube.com/watch?v=kGTmltmPYeQ (In Russ.).
Bērziņš, A. (2019). Changes of birth rates. In Z. Krišjāne & J. Krūmiņš (Eds.). Population Reproduction and Challenges for Renewal of Society in Latvia (pp. 34–49). Riga: Academic Publishing House of the University of Latvia. (In Latv.).
Brannan, D. (2006). A First Course in Mathematical Analysis. Cambridge: Cambridge University Press. https://doi.org/10.1017/CBO9780511803949.
Central Statistical Bureau of the Republic of Latvia. (2023, November 14). IDK010. Fertility rates (age-specific, total, gross and net reproduction rate, crude birth rate) 1965–2022. Statistical Database.
https://data.stat.gov.lv/pxweb/lv/OSP_PUB/START__POP__ID__IDK/IDK010/table/tableViewLayout1/
Coleman, D. (2006). Immigration and ethnic change in low-fertility countries: A Third Demographic Transition, Population and Development Review, 32(3), 401–446.
Deshpande, J. V. (2004). Mathematical Analysis and Applications: An Introduction, First edition. Alpha Science.
Eglīte, P. (2011). Birth rates and family policy in Latvia, 1990–2009. LZA Vēstis=Bulletin of the Latvia Academy of Sciences, 65(3/4). (In Latv.).
Eurostat. (2023a, October 16). Total fertility rate (tps00199). Database: Population and Demography, https://ec.europa.eu/eurostat/web/population-demography/demography-population-stockbalance/database
Gedroica, V. (2005, September 22). Differential Calculus of Functions of One Argument. https://de.du.lv/matematika/gedroica/Difrek1.pdf (In Latv.).
Eurostat. (2023b, December 29). Total fertility rate. Projection. Eurostat’s database. https://ec.europa.eu/eurostat/data/database
Hilkevics, S., & Pulkstene, A. (2019). The consideration of the methodology for the evaluation of the financial condition of Baltic stock companies. Proceedings of the International Scientific Conference “Social Sciences for Regional Development 2018”, Part III: Issues of Economics (pp. 16–23). Daugavpils: Daugavpils University Academic Publishing House “Saule”.
Interdepartmental Coordination Center. (2022, November 9). Population Reproduction Strategy FAMILY – LATVIA – 2030 (2050). https://www.pkc.gov.lv/sites/default/files/inline-files/TAS_Plans%2009.11%20projekts.pdf (In Latv.).
Kearney, M. S., & Levine, Ph. B. (2022, June 11). The causes and consequences of declining US fertility. ASPEN Economic Strategy Group. https://www.economicstrategygroup.org/publication/kearney_levine/
Klimovičs, R. (2022, December 8). Population Reproduction Strategy. Looking for a way out of the “demographic hole”. LV portals=LV portal. https://lvportals.lv/norises/346533-tautas-ataudzes-strategija-mekle-izeju-no-demografiskas-bedres-2022 (In Latv.).
Krišjāne, Z., & Krūmiņš, J. (Eds.). (2019). Population Reproduction and Challenges for Renewal of Society in Latvia. Riga: Academic Publishing House of the University of Latvia. (In Latv.).
Krūmiņš, J. (2019). Introduction. In Z. Krišjāne & J. Krūmiņš (Eds.). Population Reproduction and Challenges for Renewal of Society in Latvia (pp. 11–16). Riga: Academic Publishing House of the University of Latvia. (In Latv.).
Krūmiņš, J., & Krišjāne, Z. (2016). Demographic development in Latvia: Problems and challenges. LZA Vēstis=Bulletin of the Latvia Academy of Sciences, Part A, 40–50. (In Latv.).
Latvia Television Program “Forbidden Technique”. (2023, May 16). Europe is dying – what can be done to have more children in Latvia? Explores the “Forbidden Technique”. Latvijas Sabiedriskie Mediji Lsm.lv=Latvian Public Media. https://www.lsm.lv/raksts/zinas/zinu-analize/eiropa-izmirst-ko-darit-lai-latvija-dzimtu-vairak-bernu-peta-aizliegtais-panemiens.a491783/ (In Latv.).
Lesthaeghe, R. (2020). The second demographic transition, 1986–2020: Sub-replacement fertility and rising cohabitation – a global update. Genus, 76, 10. https://doi.org/10.1186/s41118-020-00077-4
LRT TV. (2023, February 10). Baby slump: Lithuania’s fertility rate nearly hits rock bottom. News. https://www.lrt.lt/en/news-in-english/19/2088484/baby-slump-lithuania-s-fertility-rate-nearly-hits-rock-bottom
May, J. F. (2012). World Population Policies. Their Origin, Evolution, and Impact. Dordrecht: Springer. https://doi.org/10.1007/978-94-007-2837-0
McDonald, P. (2020, February 9). A projection of Australia’s future fertility rates. Centre for Population of Australian Government. https://population.gov.au/sites/population.gov.au/files/2021-09/2020_mcdonald_fertility_projections.pdf
Mežs, I. (2011). Ethnic and regional aspects of birth in Latvia 1985-2010. LZA Vēstis=Bulletin of the Latvia Academy of Sciences, 65(3/4). (In Latv.).
Mubila, M. (2012, April 14). Briefing Note 4: Africa’s demographic trends. Briefing Notes for AfDB’s Long-Term Strategy. https://www.afdb.org/fileadmin/uploads/afdb/Documents/Policy-Documents/FINAL%20Briefing%20Note%204%20Africas%20Demographic%20Trends.pdf
Norgėlaitė, A. (2022). The impact of uncertainty created by global factors on fertility decisions.
Socialinė teorija, empirija, politika ir praktika=Social Theory, Empirics, Policy and Practice (STEPP), 25, 100–113. https://doi.org/10.15388/STEPP.2022.50
Official statistics portal. (2023, November 20). Number of births and birth rates. Latvijas oficiālā statistika=Official statistics of Latvia. https://stat.gov.lv/lv/statistikas-temas/iedzivotaji/dzimstiba/238-dzimuso-skaits-un-dzimstibas-koeficienti (In Latv.).
Ovechkina, N. I., & Shulgina, N. A. (2012). Cyclicity theory in economics and demography. Vestnik NSUEM=Bulletin of the NSUEM, 2, 105–110. (In Russ.).
Pirsko, L., Sebre, S., & Upmane, A. (2022). Exploring Factors Contributing to Marriage, Fertility, and Positive Child-Parent Relationships: A Comparison of 2022 and 2004 Survey Results. Riga: University of Latvia, Interdepartmental Coordination Center. https://pkc.gov.lv/sites/default/files/inline-files/Laulibu_dzimstibas_pozitivu_attiecibu_izpete_2022_1.pdf (In Latv.).
Pourreza, A., Sadeghi, A., Amini-Rarani, M., Khodayari-Zarnaq, R., & Jafari, H. (2021). Contributing factors to the total fertility rate declining trend in the Middle East and North Africa: A systemic review. Journal of Health, Population and Nutrition, 40(11). https://doi.org/10.1186/s41043-021-00239-w
Revina, I. (2002). Econometrics. Riga: Academic Publishing House of the University of Latvia. (In Latv.).
Roig, E. (2023). Das Ende Der Ehe. Für Eine Revolution der Liebe. Ullstein Verlag. (In Germ.).
Sherry, C. J., & Sherry, J. W. (2000). The Mathematics of Technical Analysis: Applying Statistics to Trading Stocks, Options and Futures. iUniverse.
Skirbekk, V. (2022). Decline and Prosper: Changing Global Birth Rates and the Advantages of Fewer Children, First edition. Palgrave Macmillan Cham.
Sobotka, T. (2008). The diverse faces of the second demographic transition in Europe. Demographic Research, 19, 171–222.
Statistics Estonia. (2023, December 30). RV033: Fertility indicators by year and indicator. Statistical Database. https://andmed.stat.ee/en/stat/rahvastik__rahvastikunaitajad-ja-koosseis__demograafilised-pehinaitajad/RV033/table/tableViewLayout2
Statistics Lithuania. (2023, December 30). Total Fertility Rate.
https://osp.stat.gov.lt/statistiniu-rodikliu-analize?hash=debaa6dc-f2f4-4726-bb6f-de9109c9a8bc#/
StudySmarter. (2023, December 30). Economic cycle. Macroeconomics. https://www.studysmarter.co.uk/explanations/macroeconomics/economic-performance/economic-cycle/
Tretjakova, V., Gedvilaitė-Kordušienė, M., & Rapolienė, G. (2020). Women’s pathways to childlessness in Lithuania. Sociālo Zinātņu Vēstnesis=Social Sciences Bulletin, 31(2), 7–21, https://du.lv/wp-content/uploads/2021/02/SZFvestnesis_2020-2_DRUKA.pdf
Unāma, E., & Jansone, M. (2022, September 16). The Big Interview at the Crossroads: demographer Zane Varpinya. Latvijas Radio 1=Latvia Radio I. https://lr1.lsm.lv/lv/raksts/krustpunkta/krustpunkta-liela-intervija-demografe-zane-varpina.a167968/ (In Latv.).
United Nations Department of Economic and Social Affairs. (2022, October 10). World Population Prospects 2022. https://www.un.org/development/desa/pd/sites/www.un.org.development.desa.pd/files/wpp2022_summary_of_results.pdf
Van de Kaa, D. J. (1987). Europe’s second demographic transition. Population Bulletin, 42(1), 1–59.
Volodko, I. (2007). Higher mathematics, Part I. Riga: Zvaigzne ABC. (In Latv.).
World Bank. (2023, December 22). Fertility rate, total (births per woman) – Lithuania. Data.
https://data.worldbank.org/indicator/SP.DYN.TFRT.IN?locations=LT
World Economic Forum. (2022, July 7). What Does the Global Decline of the Fertility Rate Look Like? https://www.weforum.org/agenda/2022/06/global-decline-of-fertility-rates-visualised/
Zitmane, M., & Lāma, E. (2023). “Wake up and think of the children!”: The ambivalent relationship between motherhood, femininity and anti-vaccination. In The New Communication Revolution (pp. 245–270). Uniwersytet Jagiellonski – Instytut Dziennikarstwa, Mediow i Komunikacji Spolecznej. https://www.researchgate.net/publication/372852271_Wake_up_and_think_of_the_children_The_ambivalent_relationship_between_motherhood_femininity_and_anti-vaccination
Zvidrins, P. (1979). The dynamics of fertility in Latvia. Population Studies, 33(2), 277–282. https://doi.org/10.2307/2173532
1 Total fertility rate (TFR) is a probability indicator, which shows the number of children that would be born to a woman over her childbearing period (15–49 years of age) if the fertility rate in each age group were to remain unchanged (Official statistics portal, 2023).